29
/
en
AIzaSyAYiBZKx7MnpbEhh9jyipgxe19OcubqV5w
April 1, 2024
143201
Grenada
GRD
true
2
1
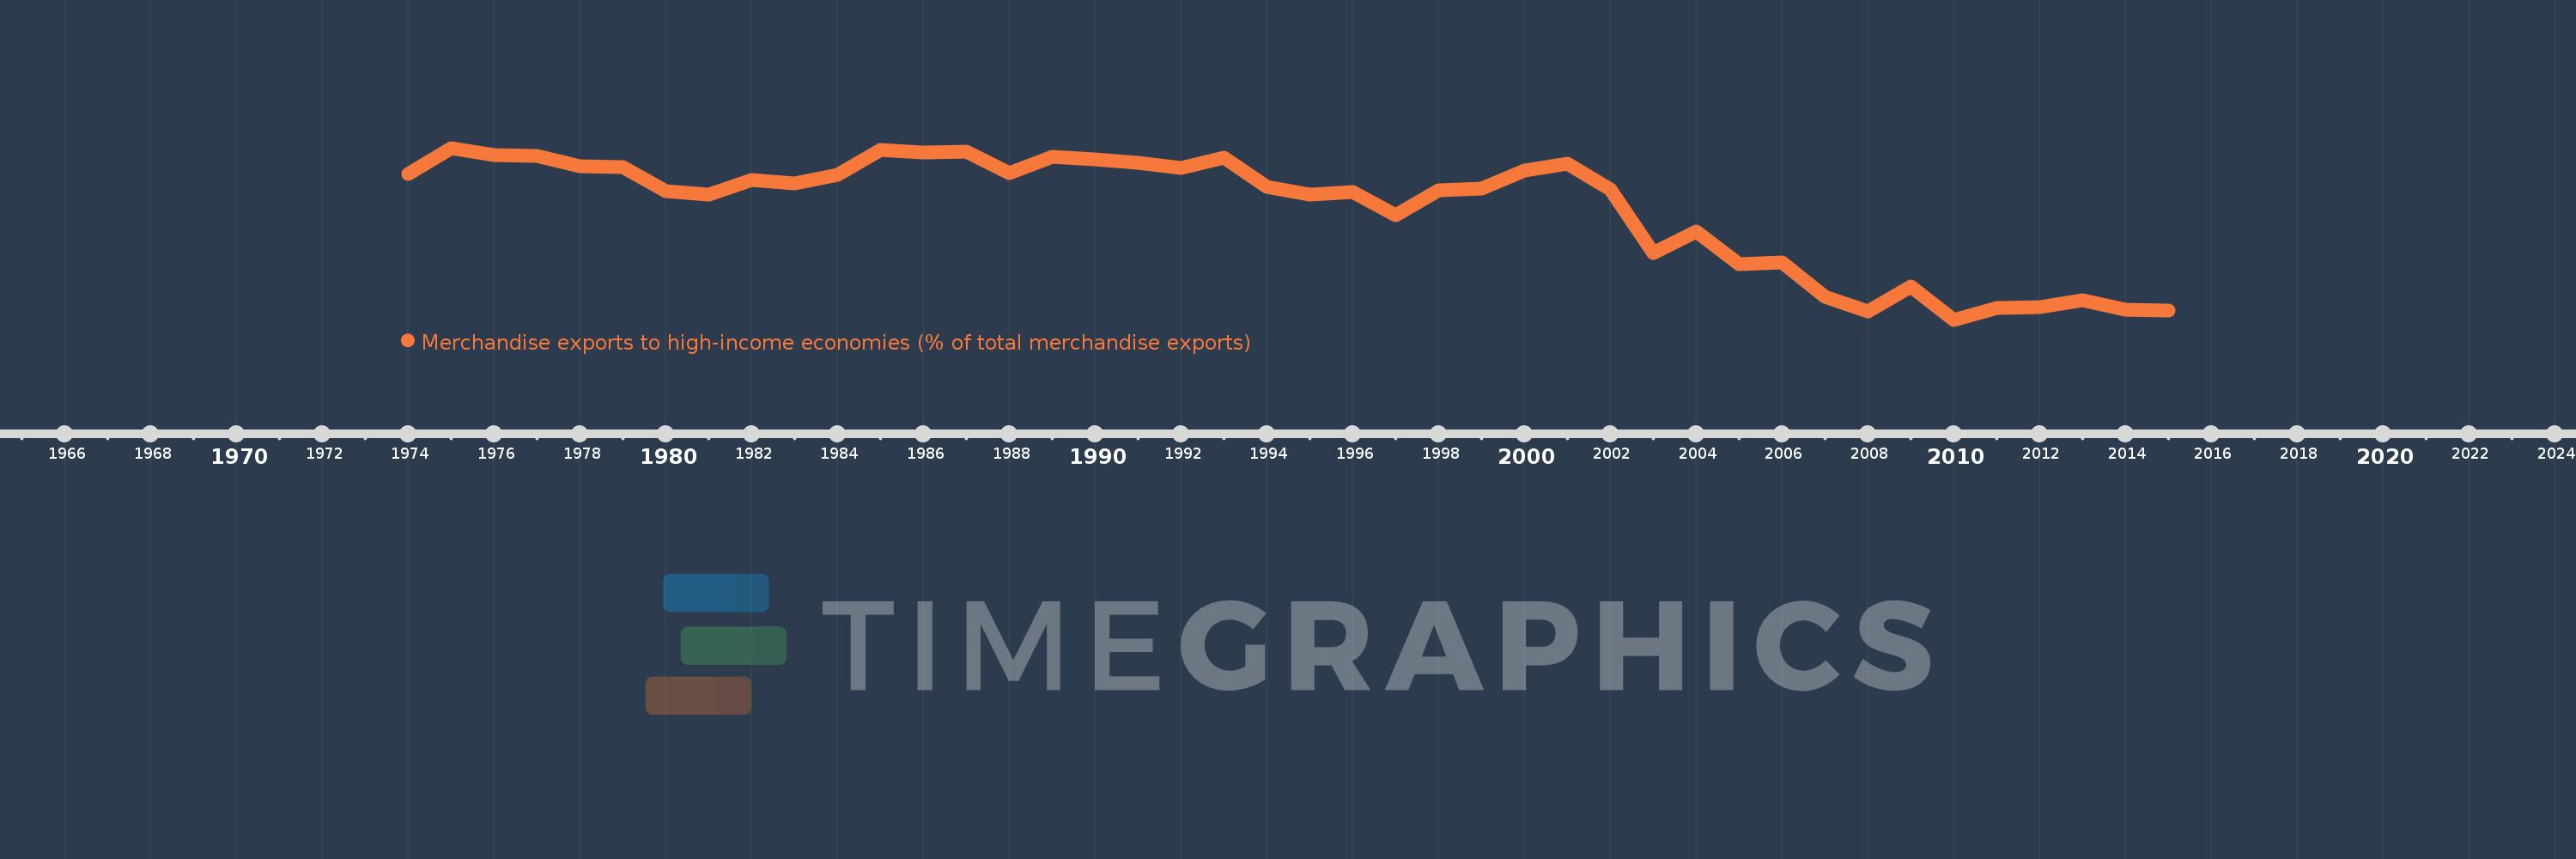
Merchandise exports to high-income economies (% of total merchandise exports)
2015,2014,2013,2012,2011,2010,2009,2008,2007,2006,2005,2004,2003,2002,2001,2000,1999,1998,1997,1996,1995,1994,1993,1992,1991,1990,1989,1988,1987,1986,1985,1984,1983,1982,1981,1980,1979,1978,1977,1976,1975,1974
This statistics in other country:
AfghanistanAlbaniaAlgeriaAmerican SamoaAngolaAntigua and BarbudaArab WorldArgentinaArmeniaArubaAustraliaAustriaAzerbaijanBahamas, TheBahrainBangladeshBarbadosBelarusBelgiumBelizeBeninBermudaBoliviaBosnia and HerzegovinaBrazilBrunei DarussalamBulgariaBurkina FasoBurundiCabo VerdeCambodiaCameroonCanadaCaribbean small statesCentral African RepublicCentral Europe and the BalticsChadChileChinaColombiaComorosCongo, Dem. Rep.Congo, Rep.Costa RicaCote d'IvoireCroatiaCubaCyprusCzech RepublicDenmarkDjiboutiDominicaDominican RepublicEarly-demographic dividendEast Asia & PacificEast Asia & Pacific (excluding high income)East Asia & Pacific (IDA & IBRD countries)EcuadorEgypt, Arab Rep.El SalvadorEquatorial GuineaEstoniaEthiopiaEuro areaEurope & Central AsiaEurope & Central Asia (excluding high income)Europe & Central Asia (IDA & IBRD countries)European UnionFaroe IslandsFijiFinlandFragile and conflict affected situationsFranceFrench PolynesiaGabonGambia, TheGeorgiaGermanyGhanaGibraltarGreeceGreenlandGrenadaGuamGuatemalaGuineaGuinea-BissauGuyanaHaitiHeavily indebted poor countries (HIPC)High incomeHondurasHong Kong SAR, ChinaHungaryIBRD onlyIcelandIDA & IBRD totalIDA blendIDA onlyIDA totalIndiaIndonesiaIran, Islamic Rep.IraqIrelandIsraelItalyJamaicaJapanJordanKazakhstanKenyaKiribatiKorea, Dem. People’s Rep.Korea, Rep.KosovoKuwaitKyrgyz RepublicLao PDRLate-demographic dividendLatin America & Caribbean Latin America & Caribbean (excluding high income)Latin America & the Caribbean (IDA & IBRD countries)LatviaLeast developed countries: UN classificationLebanonLiberiaLibyaLithuaniaLow & middle incomeLow incomeLower middle incomeLuxembourgMacao SAR, ChinaMacedonia, FYRMadagascarMalawiMalaysiaMaldivesMaliMaltaMauritaniaMauritiusMexicoMiddle East & North AfricaMiddle East & North Africa (excluding high income)Middle East & North Africa (IDA & IBRD countries)Middle incomeMoldovaMongoliaMontenegroMoroccoMozambiqueMyanmarNauruNepalNetherlandsNew CaledoniaNew ZealandNicaraguaNigerNigeriaNorth AmericaNorwayOECD membersOmanOther small statesPacific island small statesPakistanPanamaPapua New GuineaParaguayPeruPhilippinesPolandPortugalPost-demographic dividendPre-demographic dividendQatarRomaniaRussian FederationRwandaSamoaSao Tome and PrincipeSaudi ArabiaSenegalSerbiaSeychellesSierra LeoneSingaporeSlovak RepublicSloveniaSmall statesSolomon IslandsSomaliaSouth AfricaSouth AsiaSouth Asia (IDA & IBRD)SpainSri LankaSt. Kitts and NevisSt. LuciaSt. Vincent and the GrenadinesSub-Saharan Africa Sub-Saharan Africa (excluding high income)Sub-Saharan Africa (IDA & IBRD countries)SudanSurinameSwedenSwitzerlandSyrian Arab RepublicTajikistanTanzaniaThailandTogoTongaTrinidad and TobagoTunisiaTurkeyTurkmenistanTuvaluUgandaUkraineUnited Arab EmiratesUnited KingdomUnited StatesUpper middle incomeUruguayUzbekistanVanuatuVenezuela, RBVietnamWorldYemen, Rep.ZambiaZimbabwe Timeline:
This timeline shows a graph from 1974 to 2015 of Grenada. No data until 1973. Number of actual observations by date: 42.
Source name:
World Development Indicators
Source organization:
World Bank staff estimates based data from International Monetary Fund's Direction of Trade database.
Categories, topics:
Private Sector, Trade
Last updated:
apr 23, 2017
Indicators value changes by year
Minimum:
26.891
jan 1, 2010
Maximum:
95.382
jan 1, 1975
At the date of observation
Value
Absolute change
Change from previous value
jan 1, 1974
85.14
+85.14
0.0%
jan 1, 1975
95.382
+10.243
12.03%
jan 1, 1976
92.608
-2.774
-2.91%
jan 1, 1977
92.304
-0.304
-0.33%
jan 1, 1978
88.162
-4.142
-4.49%
jan 1, 1979
87.804
-0.358
-0.41%
jan 1, 1980
78.139
-9.665
-11.01%
jan 1, 1981
76.655
-1.484
-1.9%
jan 1, 1982
82.588
+5.933
7.74%
jan 1, 1983
81.396
-1.192
-1.44%
jan 1, 1984
84.561
+3.165
3.89%
jan 1, 1985
94.442
+9.882
11.69%
jan 1, 1986
93.675
-0.767
-0.81%
jan 1, 1987
93.999
+0.324
0.35%
jan 1, 1988
85.375
-8.624
-9.17%
jan 1, 1989
91.71
+6.334
7.42%
jan 1, 1990
90.977
-0.733
-0.8%
jan 1, 1991
89.322
-1.655
-1.82%
jan 1, 1992
87.284
-2.038
-2.28%
jan 1, 1993
91.477
+4.193
4.8%
jan 1, 1994
79.783
-11.694
-12.78%
jan 1, 1995
76.663
-3.119
-3.91%
jan 1, 1996
77.733
+1.069
1.4%
jan 1, 1997
68.627
-9.106
-11.71%
jan 1, 1998
78.627
+10.0
14.57%
jan 1, 1999
79.08
+0.454
0.58%
jan 1, 2000
86.261
+7.181
9.08%
jan 1, 2001
89.048
+2.787
3.23%
jan 1, 2002
78.904
-10.144
-11.39%
jan 1, 2003
53.485
-25.418
-32.21%
jan 1, 2004
61.968
+8.482
15.86%
jan 1, 2005
49.16
-12.808
-20.67%
jan 1, 2006
49.856
+0.696
1.42%
jan 1, 2007
35.938
-13.918
-27.92%
jan 1, 2008
30.279
-5.659
-15.75%
jan 1, 2009
40.116
+9.837
32.49%
jan 1, 2010
26.891
-13.225
-32.97%
jan 1, 2011
31.698
+4.807
17.88%
jan 1, 2012
31.863
+0.165
0.52%
jan 1, 2013
34.526
+2.663
8.36%
jan 1, 2014
30.994
-3.532
-10.23%
jan 1, 2015
30.422
-0.572
-1.85%
Ranking of countries by current statistics by years


Comments: