29
/
en
AIzaSyAYiBZKx7MnpbEhh9jyipgxe19OcubqV5w
April 1, 2024
221119
Paraguay
PRY
true
2
1
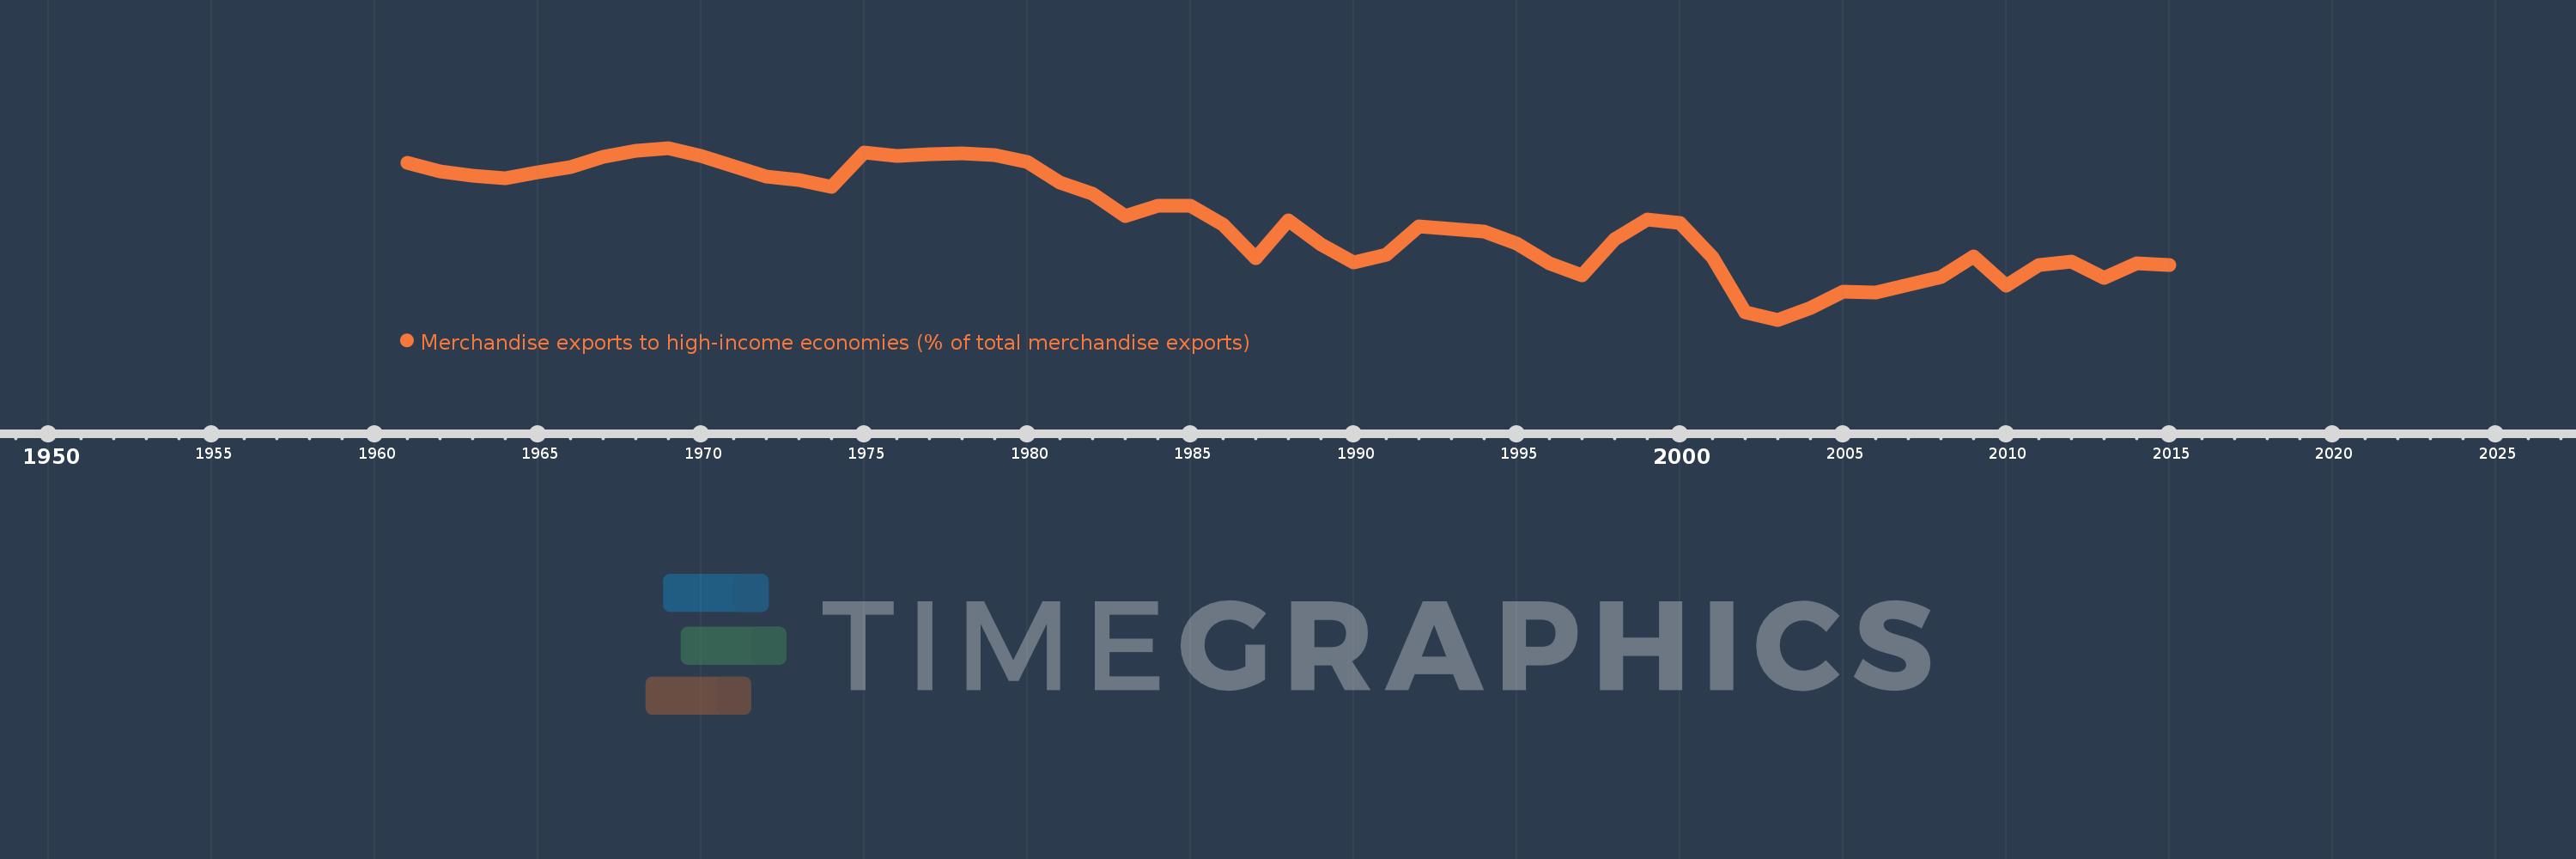
Merchandise exports to high-income economies (% of total merchandise exports)
2015,2014,2013,2012,2011,2010,2009,2008,2007,2006,2005,2004,2003,2002,2001,2000,1999,1998,1997,1996,1995,1994,1993,1992,1991,1990,1989,1988,1987,1986,1985,1984,1983,1982,1981,1980,1979,1978,1977,1976,1975,1974,1973,1972,1971,1970,1969,1968,1967,1966,1965,1964,1963,1962,1961
This statistics in other country:
AfghanistanAlbaniaAlgeriaAmerican SamoaAngolaAntigua and BarbudaArab WorldArgentinaArmeniaArubaAustraliaAustriaAzerbaijanBahamas, TheBahrainBangladeshBarbadosBelarusBelgiumBelizeBeninBermudaBoliviaBosnia and HerzegovinaBrazilBrunei DarussalamBulgariaBurkina FasoBurundiCabo VerdeCambodiaCameroonCanadaCaribbean small statesCentral African RepublicCentral Europe and the BalticsChadChileChinaColombiaComorosCongo, Dem. Rep.Congo, Rep.Costa RicaCote d'IvoireCroatiaCubaCyprusCzech RepublicDenmarkDjiboutiDominicaDominican RepublicEarly-demographic dividendEast Asia & PacificEast Asia & Pacific (excluding high income)East Asia & Pacific (IDA & IBRD countries)EcuadorEgypt, Arab Rep.El SalvadorEquatorial GuineaEstoniaEthiopiaEuro areaEurope & Central AsiaEurope & Central Asia (excluding high income)Europe & Central Asia (IDA & IBRD countries)European UnionFaroe IslandsFijiFinlandFragile and conflict affected situationsFranceFrench PolynesiaGabonGambia, TheGeorgiaGermanyGhanaGibraltarGreeceGreenlandGrenadaGuamGuatemalaGuineaGuinea-BissauGuyanaHaitiHeavily indebted poor countries (HIPC)High incomeHondurasHong Kong SAR, ChinaHungaryIBRD onlyIcelandIDA & IBRD totalIDA blendIDA onlyIDA totalIndiaIndonesiaIran, Islamic Rep.IraqIrelandIsraelItalyJamaicaJapanJordanKazakhstanKenyaKiribatiKorea, Dem. People’s Rep.Korea, Rep.KosovoKuwaitKyrgyz RepublicLao PDRLate-demographic dividendLatin America & Caribbean Latin America & Caribbean (excluding high income)Latin America & the Caribbean (IDA & IBRD countries)LatviaLeast developed countries: UN classificationLebanonLiberiaLibyaLithuaniaLow & middle incomeLow incomeLower middle incomeLuxembourgMacao SAR, ChinaMacedonia, FYRMadagascarMalawiMalaysiaMaldivesMaliMaltaMauritaniaMauritiusMexicoMiddle East & North AfricaMiddle East & North Africa (excluding high income)Middle East & North Africa (IDA & IBRD countries)Middle incomeMoldovaMongoliaMontenegroMoroccoMozambiqueMyanmarNauruNepalNetherlandsNew CaledoniaNew ZealandNicaraguaNigerNigeriaNorth AmericaNorwayOECD membersOmanOther small statesPacific island small statesPakistanPanamaPapua New GuineaParaguayPeruPhilippinesPolandPortugalPost-demographic dividendPre-demographic dividendQatarRomaniaRussian FederationRwandaSamoaSao Tome and PrincipeSaudi ArabiaSenegalSerbiaSeychellesSierra LeoneSingaporeSlovak RepublicSloveniaSmall statesSolomon IslandsSomaliaSouth AfricaSouth AsiaSouth Asia (IDA & IBRD)SpainSri LankaSt. Kitts and NevisSt. LuciaSt. Vincent and the GrenadinesSub-Saharan Africa Sub-Saharan Africa (excluding high income)Sub-Saharan Africa (IDA & IBRD countries)SudanSurinameSwedenSwitzerlandSyrian Arab RepublicTajikistanTanzaniaThailandTogoTongaTrinidad and TobagoTunisiaTurkeyTurkmenistanTuvaluUgandaUkraineUnited Arab EmiratesUnited KingdomUnited StatesUpper middle incomeUruguayUzbekistanVanuatuVenezuela, RBVietnamWorldYemen, Rep.ZambiaZimbabwe Timeline:
This timeline shows a graph from 1961 to 2015 of Paraguay. No data until 1960. Number of actual observations by date: 55.
Source name:
World Development Indicators
Source organization:
World Bank staff estimates based data from International Monetary Fund's Direction of Trade database.
Categories, topics:
Private Sector, Trade
Last updated:
apr 23, 2017
Indicators value changes by year
Minimum:
29.927
jan 1, 2003
Maximum:
91.683
jan 1, 1969
At the date of observation
Value
Absolute change
Change from previous value
jan 1, 1961
86.463
+86.463
0.0%
jan 1, 1962
83.281
-3.182
-3.68%
jan 1, 1963
81.827
-1.454
-1.75%
jan 1, 1964
80.868
-0.959
-1.17%
jan 1, 1965
82.896
+2.028
2.51%
jan 1, 1966
84.643
+1.748
2.11%
jan 1, 1967
88.402
+3.759
4.44%
jan 1, 1968
90.591
+2.189
2.48%
jan 1, 1969
91.683
+1.092
1.21%
jan 1, 1970
88.886
-2.797
-3.05%
jan 1, 1971
85.084
-3.802
-4.28%
jan 1, 1972
81.288
-3.796
-4.46%
jan 1, 1973
80.121
-1.167
-1.44%
jan 1, 1974
77.749
-2.372
-2.96%
jan 1, 1975
89.984
+12.235
15.74%
jan 1, 1976
88.689
-1.295
-1.44%
jan 1, 1977
89.544
+0.855
0.96%
jan 1, 1978
89.635
+0.091
0.1%
jan 1, 1979
89.074
-0.562
-0.63%
jan 1, 1980
86.772
-2.301
-2.58%
jan 1, 1981
79.277
-7.496
-8.64%
jan 1, 1982
75.303
-3.974
-5.01%
jan 1, 1983
67.268
-8.035
-10.67%
jan 1, 1984
70.812
+3.544
5.27%
jan 1, 1985
70.914
+0.102
0.14%
jan 1, 1986
64.233
-6.682
-9.42%
jan 1, 1987
52.209
-12.024
-18.72%
jan 1, 1988
65.788
+13.579
26.01%
jan 1, 1989
57.03
-8.757
-13.31%
jan 1, 1990
50.646
-6.384
-11.19%
jan 1, 1991
53.24
+2.593
5.12%
jan 1, 1992
63.523
+10.283
19.31%
jan 1, 1993
62.583
-0.94
-1.48%
jan 1, 1994
61.619
-0.964
-1.54%
jan 1, 1995
57.387
-4.232
-6.87%
jan 1, 1996
50.348
-7.039
-12.27%
jan 1, 1997
45.928
-4.42
-8.78%
jan 1, 1998
58.818
+12.889
28.06%
jan 1, 1999
66.114
+7.297
12.41%
jan 1, 2000
64.796
-1.319
-1.99%
jan 1, 2001
52.32
-12.476
-19.25%
jan 1, 2002
32.508
-19.812
-37.87%
jan 1, 2003
29.927
-2.581
-7.94%
jan 1, 2004
34.079
+4.152
13.87%
jan 1, 2005
39.954
+5.875
17.24%
jan 1, 2006
39.76
-0.195
-0.49%
jan 1, 2007
42.458
+2.699
6.79%
jan 1, 2008
45.202
+2.743
6.46%
jan 1, 2009
52.835
+7.633
16.89%
jan 1, 2010
42.239
-10.597
-20.06%
jan 1, 2011
49.621
+7.383
17.48%
jan 1, 2012
50.897
+1.276
2.57%
jan 1, 2013
45.091
-5.807
-11.41%
jan 1, 2014
50.077
+4.986
11.06%
jan 1, 2015
49.691
-0.386
-0.77%
Ranking of countries by current statistics by years


Comments: