29
/
en
AIzaSyAYiBZKx7MnpbEhh9jyipgxe19OcubqV5w
April 1, 2024
282558
Vietnam
VNM
true
2
1
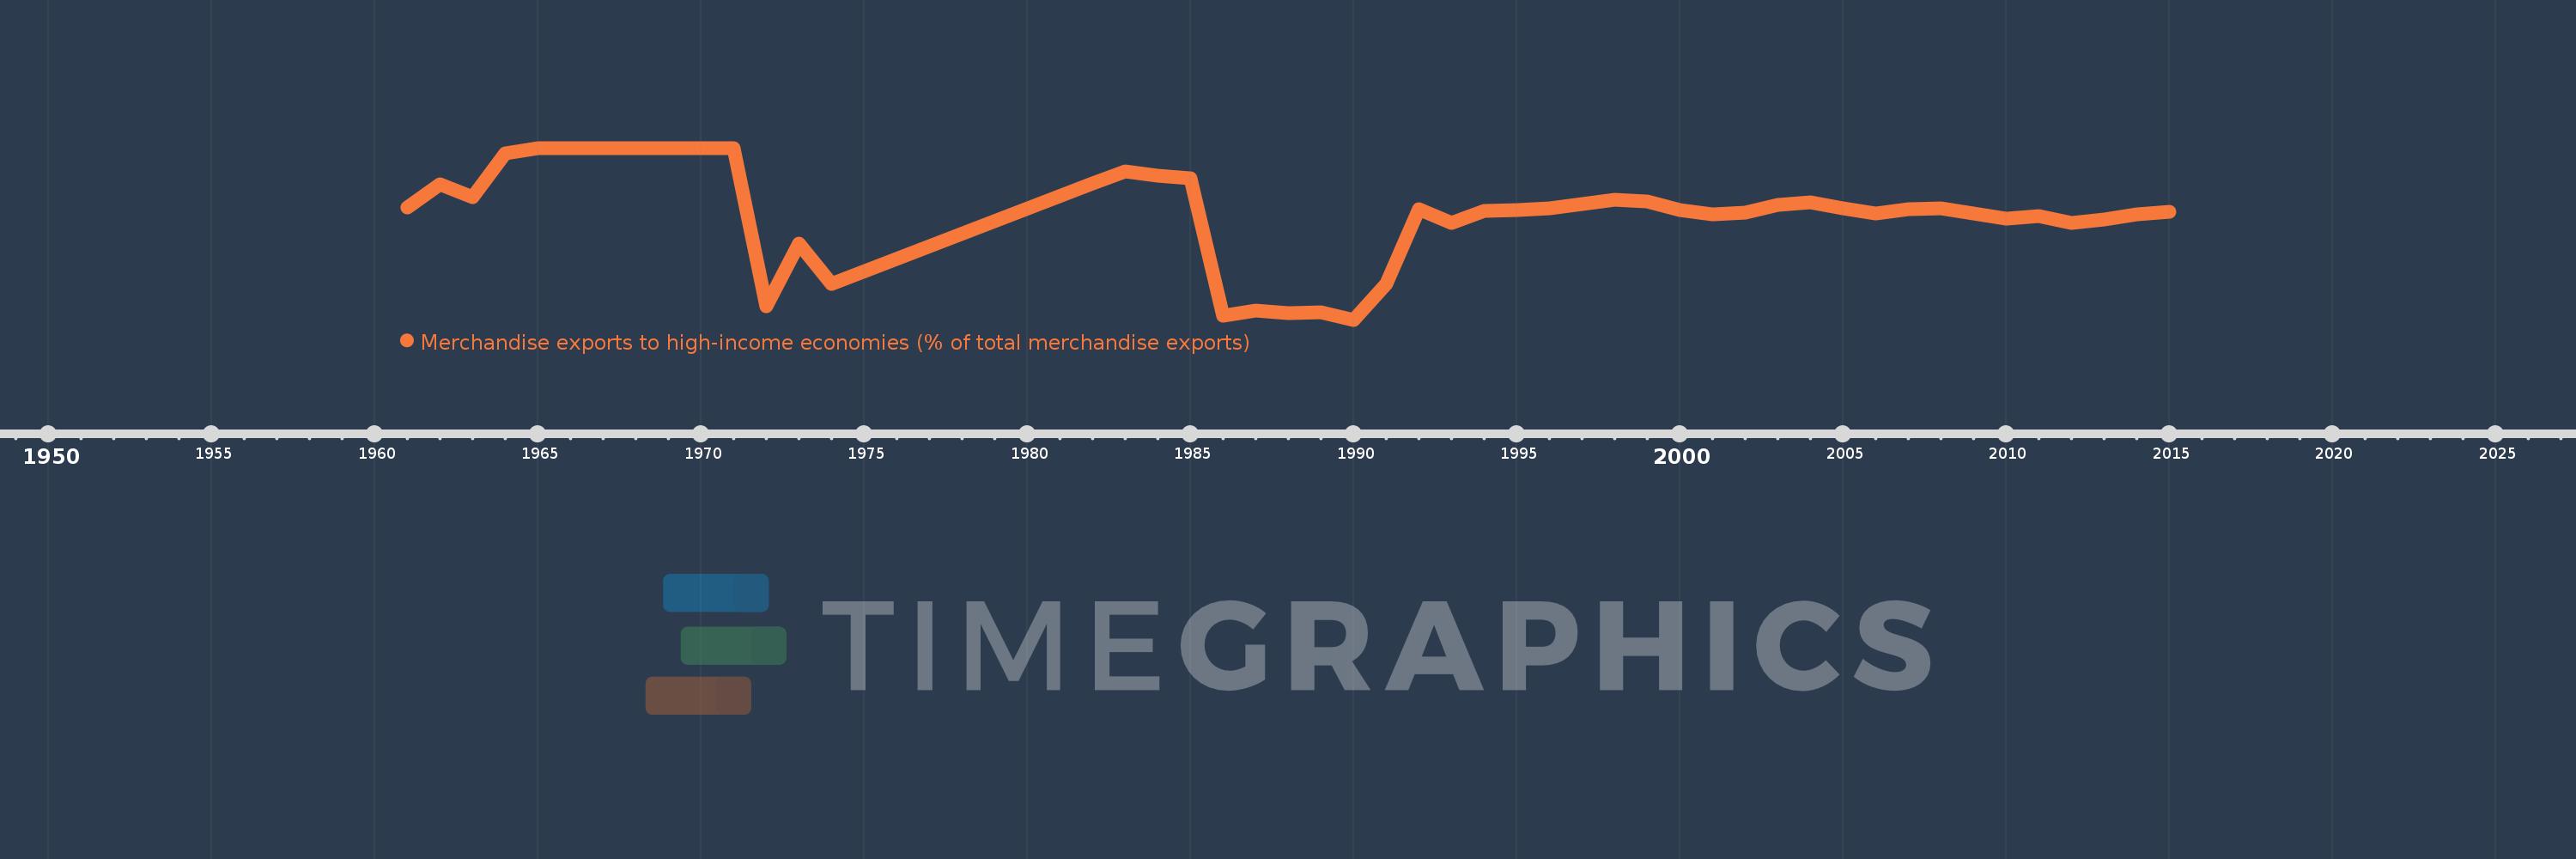
Merchandise exports to high-income economies (% of total merchandise exports)
2015,2014,2013,2012,2011,2010,2009,2008,2007,2006,2005,2004,2003,2002,2001,2000,1999,1998,1997,1996,1995,1994,1993,1992,1991,1990,1989,1988,1987,1986,1985,1984,1983,1982,1974,1973,1972,1971,1970,1969,1968,1967,1966,1965,1964,1963,1962,1961
This statistics in other country:
AfghanistanAlbaniaAlgeriaAmerican SamoaAngolaAntigua and BarbudaArab WorldArgentinaArmeniaArubaAustraliaAustriaAzerbaijanBahamas, TheBahrainBangladeshBarbadosBelarusBelgiumBelizeBeninBermudaBoliviaBosnia and HerzegovinaBrazilBrunei DarussalamBulgariaBurkina FasoBurundiCabo VerdeCambodiaCameroonCanadaCaribbean small statesCentral African RepublicCentral Europe and the BalticsChadChileChinaColombiaComorosCongo, Dem. Rep.Congo, Rep.Costa RicaCote d'IvoireCroatiaCubaCyprusCzech RepublicDenmarkDjiboutiDominicaDominican RepublicEarly-demographic dividendEast Asia & PacificEast Asia & Pacific (excluding high income)East Asia & Pacific (IDA & IBRD countries)EcuadorEgypt, Arab Rep.El SalvadorEquatorial GuineaEstoniaEthiopiaEuro areaEurope & Central AsiaEurope & Central Asia (excluding high income)Europe & Central Asia (IDA & IBRD countries)European UnionFaroe IslandsFijiFinlandFragile and conflict affected situationsFranceFrench PolynesiaGabonGambia, TheGeorgiaGermanyGhanaGibraltarGreeceGreenlandGrenadaGuamGuatemalaGuineaGuinea-BissauGuyanaHaitiHeavily indebted poor countries (HIPC)High incomeHondurasHong Kong SAR, ChinaHungaryIBRD onlyIcelandIDA & IBRD totalIDA blendIDA onlyIDA totalIndiaIndonesiaIran, Islamic Rep.IraqIrelandIsraelItalyJamaicaJapanJordanKazakhstanKenyaKiribatiKorea, Dem. People’s Rep.Korea, Rep.KosovoKuwaitKyrgyz RepublicLao PDRLate-demographic dividendLatin America & Caribbean Latin America & Caribbean (excluding high income)Latin America & the Caribbean (IDA & IBRD countries)LatviaLeast developed countries: UN classificationLebanonLiberiaLibyaLithuaniaLow & middle incomeLow incomeLower middle incomeLuxembourgMacao SAR, ChinaMacedonia, FYRMadagascarMalawiMalaysiaMaldivesMaliMaltaMauritaniaMauritiusMexicoMiddle East & North AfricaMiddle East & North Africa (excluding high income)Middle East & North Africa (IDA & IBRD countries)Middle incomeMoldovaMongoliaMontenegroMoroccoMozambiqueMyanmarNauruNepalNetherlandsNew CaledoniaNew ZealandNicaraguaNigerNigeriaNorth AmericaNorwayOECD membersOmanOther small statesPacific island small statesPakistanPanamaPapua New GuineaParaguayPeruPhilippinesPolandPortugalPost-demographic dividendPre-demographic dividendQatarRomaniaRussian FederationRwandaSamoaSao Tome and PrincipeSaudi ArabiaSenegalSerbiaSeychellesSierra LeoneSingaporeSlovak RepublicSloveniaSmall statesSolomon IslandsSomaliaSouth AfricaSouth AsiaSouth Asia (IDA & IBRD)SpainSri LankaSt. Kitts and NevisSt. LuciaSt. Vincent and the GrenadinesSub-Saharan Africa Sub-Saharan Africa (excluding high income)Sub-Saharan Africa (IDA & IBRD countries)SudanSurinameSwedenSwitzerlandSyrian Arab RepublicTajikistanTanzaniaThailandTogoTongaTrinidad and TobagoTunisiaTurkeyTurkmenistanTuvaluUgandaUkraineUnited Arab EmiratesUnited KingdomUnited StatesUpper middle incomeUruguayUzbekistanVanuatuVenezuela, RBVietnamWorldYemen, Rep.ZambiaZimbabwe Timeline:
This timeline shows a graph from 1961 to 2015 of Vietnam. No data until 1960. Number of actual observations by date: 48.
Source name:
World Development Indicators
Source organization:
World Bank staff estimates based data from International Monetary Fund's Direction of Trade database.
Categories, topics:
Private Sector, Trade
Last updated:
apr 23, 2017
Indicators value changes by year
Minimum:
26.292
jan 1, 1990
At the date of observation
Value
Absolute change
Change from previous value
jan 1, 1961
74.41
+74.41
0.0%
jan 1, 1962
84.302
+9.892
13.29%
jan 1, 1963
78.74
-5.562
-6.6%
jan 1, 1964
97.778
+19.038
24.18%
jan 1, 1965
100.0
+2.222
2.27%
jan 1, 1966
100.0
0.0
0.0%
jan 1, 1967
100.0
0.0
0.0%
jan 1, 1968
100.0
0.0
0.0%
jan 1, 1969
100.0
0.0
0.0%
jan 1, 1970
100.0
0.0
0.0%
jan 1, 1971
100.0
0.0
0.0%
jan 1, 1972
32.061
-67.939
-67.94%
jan 1, 1973
58.96
+26.899
83.9%
jan 1, 1974
41.513
-17.447
-29.59%
jan 1, 1982
84.896
+43.383
104.5%
jan 1, 1983
90.057
+5.162
6.08%
jan 1, 1984
88.241
-1.816
-2.02%
jan 1, 1985
87.165
-1.076
-1.22%
jan 1, 1986
27.905
-59.26
-67.99%
jan 1, 1987
30.36
+2.454
8.79%
jan 1, 1988
29.085
-1.275
-4.2%
jan 1, 1989
29.541
+0.456
1.57%
jan 1, 1990
26.292
-3.249
-11.0%
jan 1, 1991
41.5
+15.208
57.84%
jan 1, 1992
73.766
+32.266
77.75%
jan 1, 1993
67.944
-5.821
-7.89%
jan 1, 1994
73.064
+5.119
7.53%
jan 1, 1995
73.188
+0.124
0.17%
jan 1, 1996
74.197
+1.009
1.38%
jan 1, 1997
75.829
+1.632
2.2%
jan 1, 1998
77.654
+1.825
2.41%
jan 1, 1999
76.988
-0.666
-0.86%
jan 1, 2000
73.216
-3.772
-4.9%
jan 1, 2001
71.657
-1.559
-2.13%
jan 1, 2002
72.219
+0.562
0.78%
jan 1, 2003
75.607
+3.388
4.69%
jan 1, 2004
76.852
+1.245
1.65%
jan 1, 2005
74.103
-2.749
-3.58%
jan 1, 2006
72.044
-2.06
-2.78%
jan 1, 2007
73.786
+1.742
2.42%
jan 1, 2008
74.108
+0.322
0.44%
jan 1, 2009
71.713
-2.395
-3.23%
jan 1, 2010
69.577
-2.136
-2.98%
jan 1, 2011
70.927
+1.35
1.94%
jan 1, 2012
67.746
-3.181
-4.48%
jan 1, 2013
69.238
+1.492
2.2%
jan 1, 2014
71.433
+2.196
3.17%
jan 1, 2015
72.483
+1.05
1.47%
Ranking of countries by current statistics by years


Comments: