29
/
en
AIzaSyAYiBZKx7MnpbEhh9jyipgxe19OcubqV5w
April 1, 2024
40090
IDA total
IDA
false
2
1
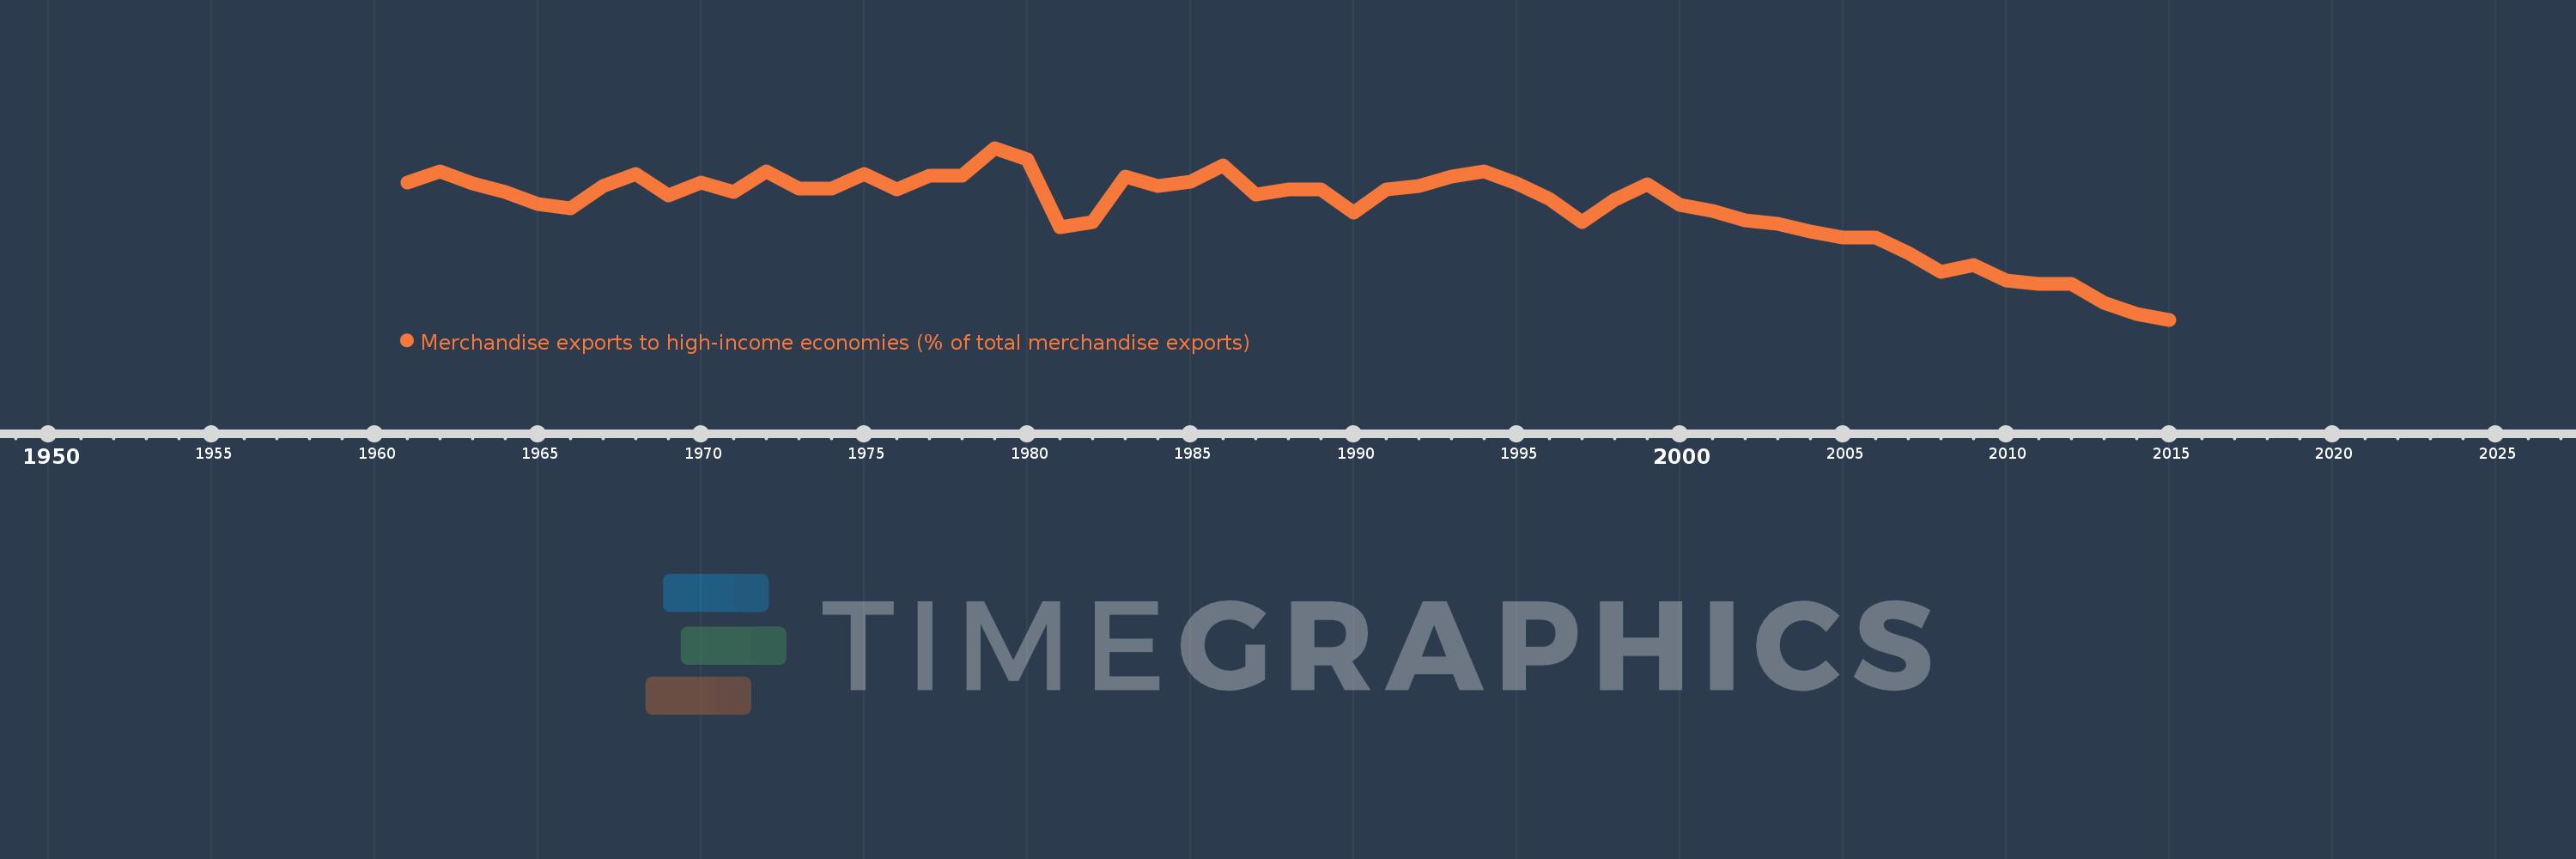
Merchandise exports to high-income economies (% of total merchandise exports)
2015,2014,2013,2012,2011,2010,2009,2008,2007,2006,2005,2004,2003,2002,2001,2000,1999,1998,1997,1996,1995,1994,1993,1992,1991,1990,1989,1988,1987,1986,1985,1984,1983,1982,1981,1980,1979,1978,1977,1976,1975,1974,1973,1972,1971,1970,1969,1968,1967,1966,1965,1964,1963,1962,1961
This statistics in other country:
AfghanistanAlbaniaAlgeriaAmerican SamoaAngolaAntigua and BarbudaArab WorldArgentinaArmeniaArubaAustraliaAustriaAzerbaijanBahamas, TheBahrainBangladeshBarbadosBelarusBelgiumBelizeBeninBermudaBoliviaBosnia and HerzegovinaBrazilBrunei DarussalamBulgariaBurkina FasoBurundiCabo VerdeCambodiaCameroonCanadaCaribbean small statesCentral African RepublicCentral Europe and the BalticsChadChileChinaColombiaComorosCongo, Dem. Rep.Congo, Rep.Costa RicaCote d'IvoireCroatiaCubaCyprusCzech RepublicDenmarkDjiboutiDominicaDominican RepublicEarly-demographic dividendEast Asia & PacificEast Asia & Pacific (excluding high income)East Asia & Pacific (IDA & IBRD countries)EcuadorEgypt, Arab Rep.El SalvadorEquatorial GuineaEstoniaEthiopiaEuro areaEurope & Central AsiaEurope & Central Asia (excluding high income)Europe & Central Asia (IDA & IBRD countries)European UnionFaroe IslandsFijiFinlandFragile and conflict affected situationsFranceFrench PolynesiaGabonGambia, TheGeorgiaGermanyGhanaGibraltarGreeceGreenlandGrenadaGuamGuatemalaGuineaGuinea-BissauGuyanaHaitiHeavily indebted poor countries (HIPC)High incomeHondurasHong Kong SAR, ChinaHungaryIBRD onlyIcelandIDA & IBRD totalIDA blendIDA onlyIDA totalIndiaIndonesiaIran, Islamic Rep.IraqIrelandIsraelItalyJamaicaJapanJordanKazakhstanKenyaKiribatiKorea, Dem. People’s Rep.Korea, Rep.KosovoKuwaitKyrgyz RepublicLao PDRLate-demographic dividendLatin America & Caribbean Latin America & Caribbean (excluding high income)Latin America & the Caribbean (IDA & IBRD countries)LatviaLeast developed countries: UN classificationLebanonLiberiaLibyaLithuaniaLow & middle incomeLow incomeLower middle incomeLuxembourgMacao SAR, ChinaMacedonia, FYRMadagascarMalawiMalaysiaMaldivesMaliMaltaMauritaniaMauritiusMexicoMiddle East & North AfricaMiddle East & North Africa (excluding high income)Middle East & North Africa (IDA & IBRD countries)Middle incomeMoldovaMongoliaMontenegroMoroccoMozambiqueMyanmarNauruNepalNetherlandsNew CaledoniaNew ZealandNicaraguaNigerNigeriaNorth AmericaNorwayOECD membersOmanOther small statesPacific island small statesPakistanPanamaPapua New GuineaParaguayPeruPhilippinesPolandPortugalPost-demographic dividendPre-demographic dividendQatarRomaniaRussian FederationRwandaSamoaSao Tome and PrincipeSaudi ArabiaSenegalSerbiaSeychellesSierra LeoneSingaporeSlovak RepublicSloveniaSmall statesSolomon IslandsSomaliaSouth AfricaSouth AsiaSouth Asia (IDA & IBRD)SpainSri LankaSt. Kitts and NevisSt. LuciaSt. Vincent and the GrenadinesSub-Saharan Africa Sub-Saharan Africa (excluding high income)Sub-Saharan Africa (IDA & IBRD countries)SudanSurinameSwedenSwitzerlandSyrian Arab RepublicTajikistanTanzaniaThailandTogoTongaTrinidad and TobagoTunisiaTurkeyTurkmenistanTuvaluUgandaUkraineUnited Arab EmiratesUnited KingdomUnited StatesUpper middle incomeUruguayUzbekistanVanuatuVenezuela, RBVietnamWorldYemen, Rep.ZambiaZimbabwe Timeline:
This timeline shows a graph from 1961 to 2015 of IDA total. No data until 1960. Number of actual observations by date: 55.
Source name:
World Development Indicators
Source organization:
World Bank staff estimates based data from International Monetary Fund's Direction of Trade database.
Categories, topics:
Private Sector, Trade
Last updated:
apr 23, 2017
Indicators value changes by year
Minimum:
56.072
jan 1, 2015
Maximum:
76.748
jan 1, 1979
At the date of observation
Value
Absolute change
Change from previous value
jan 1, 1961
72.624
+72.624
0.0%
jan 1, 1962
73.968
+1.344
1.85%
jan 1, 1963
72.51
-1.458
-1.97%
jan 1, 1964
71.398
-1.112
-1.53%
jan 1, 1965
69.949
-1.449
-2.03%
jan 1, 1966
69.506
-0.443
-0.63%
jan 1, 1967
72.19
+2.684
3.86%
jan 1, 1968
73.622
+1.433
1.98%
jan 1, 1969
71.062
-2.561
-3.48%
jan 1, 1970
72.594
+1.532
2.16%
jan 1, 1971
71.487
-1.107
-1.52%
jan 1, 1972
73.946
+2.458
3.44%
jan 1, 1973
71.875
-2.07
-2.8%
jan 1, 1974
71.838
-0.037
-0.05%
jan 1, 1975
73.656
+1.818
2.53%
jan 1, 1976
71.799
-1.857
-2.52%
jan 1, 1977
73.364
+1.565
2.18%
jan 1, 1978
73.371
+0.007
0.01%
jan 1, 1979
76.748
+3.377
4.6%
jan 1, 1980
75.343
-1.405
-1.83%
jan 1, 1981
67.222
-8.121
-10.78%
jan 1, 1982
67.787
+0.565
0.84%
jan 1, 1983
73.295
+5.508
8.13%
jan 1, 1984
72.128
-1.166
-1.59%
jan 1, 1985
72.655
+0.527
0.73%
jan 1, 1986
74.605
+1.95
2.68%
jan 1, 1987
71.135
-3.47
-4.65%
jan 1, 1988
71.771
+0.636
0.89%
jan 1, 1989
71.713
-0.058
-0.08%
jan 1, 1990
68.953
-2.76
-3.85%
jan 1, 1991
71.766
+2.813
4.08%
jan 1, 1992
72.132
+0.366
0.51%
jan 1, 1993
73.339
+1.207
1.67%
jan 1, 1994
73.955
+0.616
0.84%
jan 1, 1995
72.512
-1.443
-1.95%
jan 1, 1996
70.612
-1.901
-2.62%
jan 1, 1997
67.811
-2.801
-3.97%
jan 1, 1998
70.503
+2.692
3.97%
jan 1, 1999
72.329
+1.826
2.59%
jan 1, 2000
69.904
-2.425
-3.35%
jan 1, 2001
69.175
-0.729
-1.04%
jan 1, 2002
68.07
-1.105
-1.6%
jan 1, 2003
67.622
-0.448
-0.66%
jan 1, 2004
66.642
-0.981
-1.45%
jan 1, 2005
65.987
-0.655
-0.98%
jan 1, 2006
65.943
-0.044
-0.07%
jan 1, 2007
64.059
-1.884
-2.86%
jan 1, 2008
61.833
-2.225
-3.47%
jan 1, 2009
62.662
+0.829
1.34%
jan 1, 2010
60.783
-1.879
-3.0%
jan 1, 2011
60.384
-0.399
-0.66%
jan 1, 2012
60.397
+0.013
0.02%
jan 1, 2013
58.082
-2.315
-3.83%
jan 1, 2014
56.736
-1.346
-2.32%
jan 1, 2015
56.072
-0.665
-1.17%
Ranking of countries by current statistics by years


Comments: