29
/
en
AIzaSyAYiBZKx7MnpbEhh9jyipgxe19OcubqV5w
April 1, 2024
57278
South Asia
SAS
false
2
1
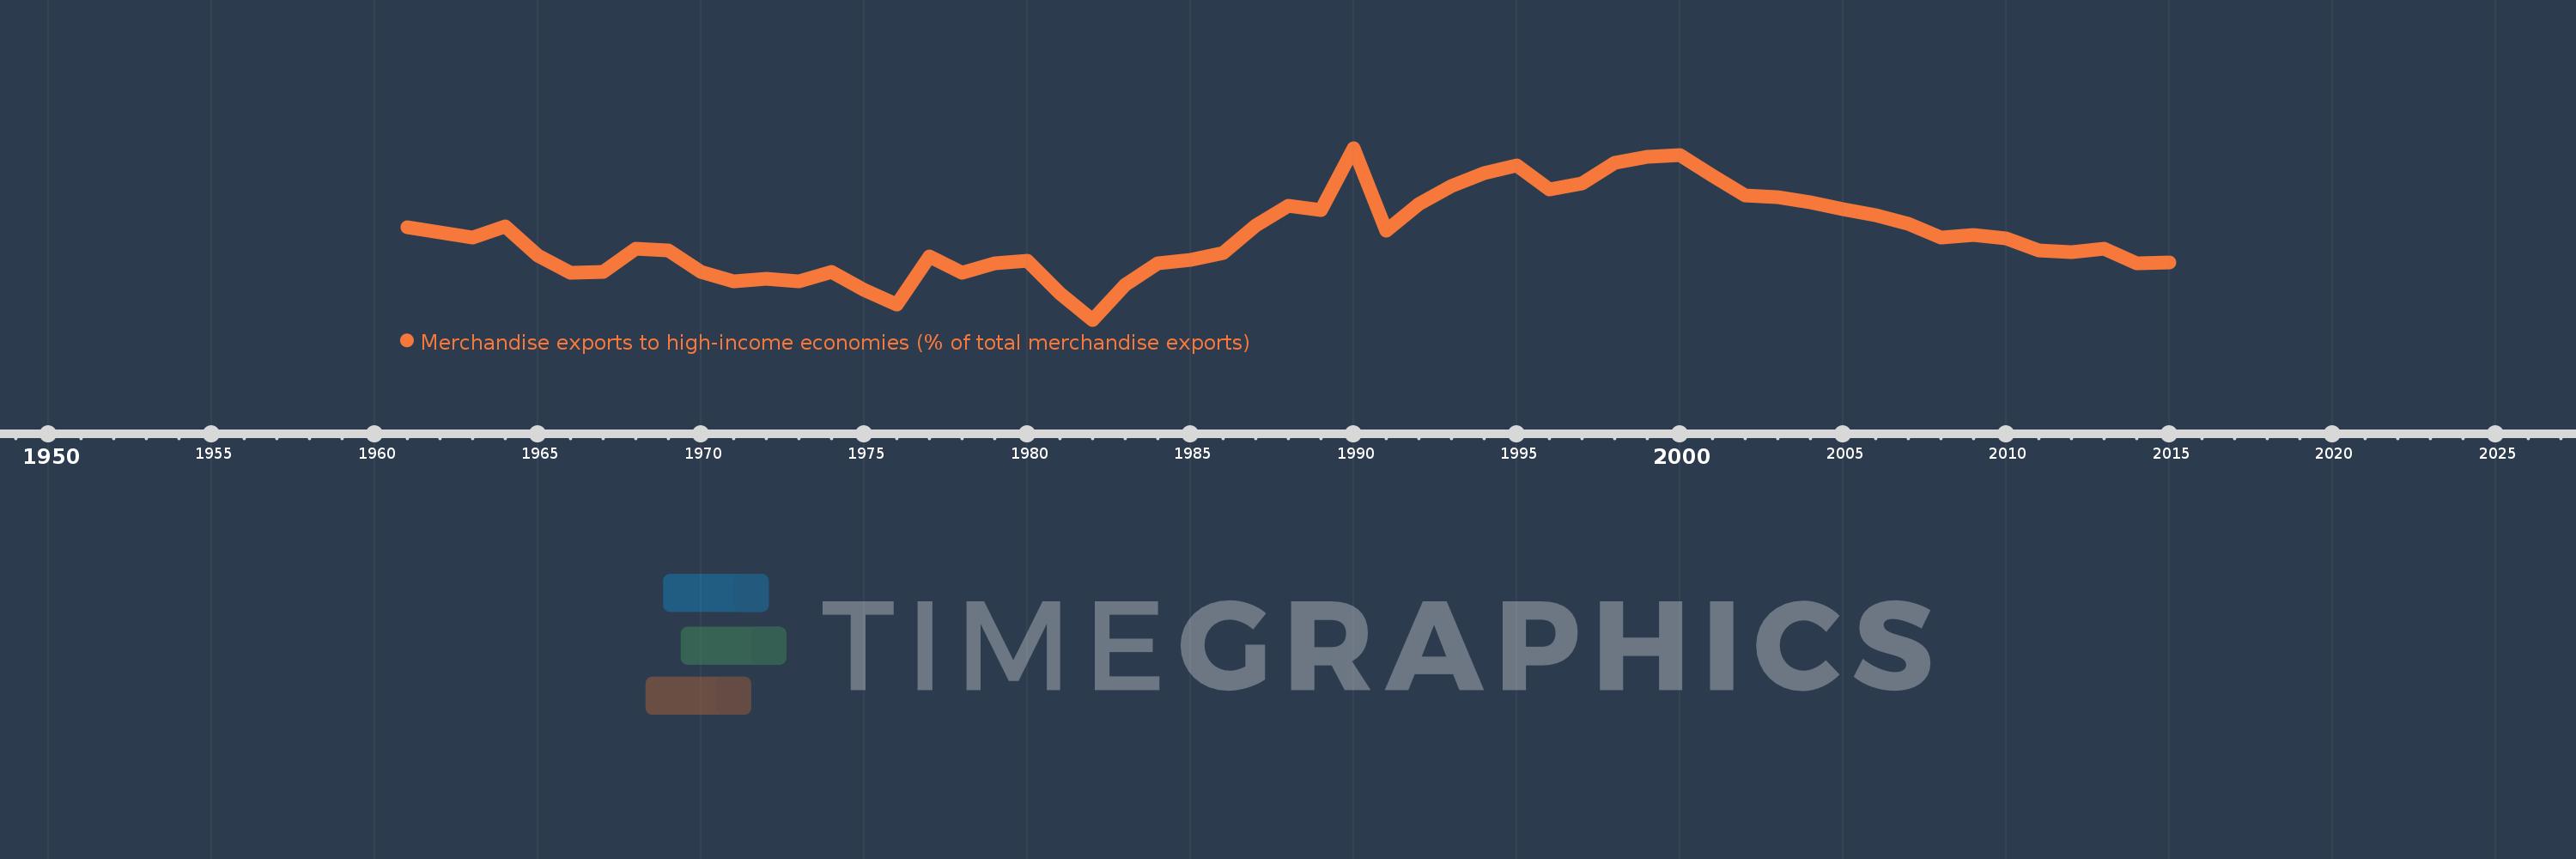
Merchandise exports to high-income economies (% of total merchandise exports)
2015,2014,2013,2012,2011,2010,2009,2008,2007,2006,2005,2004,2003,2002,2001,2000,1999,1998,1997,1996,1995,1994,1993,1992,1991,1990,1989,1988,1987,1986,1985,1984,1983,1982,1981,1980,1979,1978,1977,1976,1975,1974,1973,1972,1971,1970,1969,1968,1967,1966,1965,1964,1963,1962,1961
This statistics in other country:
AfghanistanAlbaniaAlgeriaAmerican SamoaAngolaAntigua and BarbudaArab WorldArgentinaArmeniaArubaAustraliaAustriaAzerbaijanBahamas, TheBahrainBangladeshBarbadosBelarusBelgiumBelizeBeninBermudaBoliviaBosnia and HerzegovinaBrazilBrunei DarussalamBulgariaBurkina FasoBurundiCabo VerdeCambodiaCameroonCanadaCaribbean small statesCentral African RepublicCentral Europe and the BalticsChadChileChinaColombiaComorosCongo, Dem. Rep.Congo, Rep.Costa RicaCote d'IvoireCroatiaCubaCyprusCzech RepublicDenmarkDjiboutiDominicaDominican RepublicEarly-demographic dividendEast Asia & PacificEast Asia & Pacific (excluding high income)East Asia & Pacific (IDA & IBRD countries)EcuadorEgypt, Arab Rep.El SalvadorEquatorial GuineaEstoniaEthiopiaEuro areaEurope & Central AsiaEurope & Central Asia (excluding high income)Europe & Central Asia (IDA & IBRD countries)European UnionFaroe IslandsFijiFinlandFragile and conflict affected situationsFranceFrench PolynesiaGabonGambia, TheGeorgiaGermanyGhanaGibraltarGreeceGreenlandGrenadaGuamGuatemalaGuineaGuinea-BissauGuyanaHaitiHeavily indebted poor countries (HIPC)High incomeHondurasHong Kong SAR, ChinaHungaryIBRD onlyIcelandIDA & IBRD totalIDA blendIDA onlyIDA totalIndiaIndonesiaIran, Islamic Rep.IraqIrelandIsraelItalyJamaicaJapanJordanKazakhstanKenyaKiribatiKorea, Dem. People’s Rep.Korea, Rep.KosovoKuwaitKyrgyz RepublicLao PDRLate-demographic dividendLatin America & Caribbean Latin America & Caribbean (excluding high income)Latin America & the Caribbean (IDA & IBRD countries)LatviaLeast developed countries: UN classificationLebanonLiberiaLibyaLithuaniaLow & middle incomeLow incomeLower middle incomeLuxembourgMacao SAR, ChinaMacedonia, FYRMadagascarMalawiMalaysiaMaldivesMaliMaltaMauritaniaMauritiusMexicoMiddle East & North AfricaMiddle East & North Africa (excluding high income)Middle East & North Africa (IDA & IBRD countries)Middle incomeMoldovaMongoliaMontenegroMoroccoMozambiqueMyanmarNauruNepalNetherlandsNew CaledoniaNew ZealandNicaraguaNigerNigeriaNorth AmericaNorwayOECD membersOmanOther small statesPacific island small statesPakistanPanamaPapua New GuineaParaguayPeruPhilippinesPolandPortugalPost-demographic dividendPre-demographic dividendQatarRomaniaRussian FederationRwandaSamoaSao Tome and PrincipeSaudi ArabiaSenegalSerbiaSeychellesSierra LeoneSingaporeSlovak RepublicSloveniaSmall statesSolomon IslandsSomaliaSouth AfricaSouth AsiaSouth Asia (IDA & IBRD)SpainSri LankaSt. Kitts and NevisSt. LuciaSt. Vincent and the GrenadinesSub-Saharan Africa Sub-Saharan Africa (excluding high income)Sub-Saharan Africa (IDA & IBRD countries)SudanSurinameSwedenSwitzerlandSyrian Arab RepublicTajikistanTanzaniaThailandTogoTongaTrinidad and TobagoTunisiaTurkeyTurkmenistanTuvaluUgandaUkraineUnited Arab EmiratesUnited KingdomUnited StatesUpper middle incomeUruguayUzbekistanVanuatuVenezuela, RBVietnamWorldYemen, Rep.ZambiaZimbabwe Timeline:
This timeline shows a graph from 1961 to 2015 of South Asia. No data until 1960. Number of actual observations by date: 55.
Source name:
World Development Indicators
Source organization:
World Bank staff estimates based data from International Monetary Fund's Direction of Trade database.
Categories, topics:
Private Sector, Trade
Last updated:
apr 23, 2017
Indicators value changes by year
Minimum:
52.362
jan 1, 1982
Maximum:
82.333
jan 1, 1990
At the date of observation
Value
Absolute change
Change from previous value
jan 1, 1961
68.489
+68.489
0.0%
jan 1, 1962
67.668
-0.82
-1.2%
jan 1, 1963
66.699
-0.969
-1.43%
jan 1, 1964
68.601
+1.902
2.85%
jan 1, 1965
63.629
-4.972
-7.25%
jan 1, 1966
60.562
-3.066
-4.82%
jan 1, 1967
60.782
+0.22
0.36%
jan 1, 1968
64.807
+4.024
6.62%
jan 1, 1969
64.384
-0.422
-0.65%
jan 1, 1970
60.71
-3.675
-5.71%
jan 1, 1971
59.052
-1.658
-2.73%
jan 1, 1972
59.442
+0.39
0.66%
jan 1, 1973
58.995
-0.448
-0.75%
jan 1, 1974
60.715
+1.72
2.92%
jan 1, 1975
57.554
-3.161
-5.21%
jan 1, 1976
55.064
-2.491
-4.33%
jan 1, 1977
63.466
+8.402
15.26%
jan 1, 1978
60.504
-2.963
-4.67%
jan 1, 1979
62.263
+1.759
2.91%
jan 1, 1980
62.633
+0.37
0.59%
jan 1, 1981
56.914
-5.719
-9.13%
jan 1, 1982
52.362
-4.552
-8.0%
jan 1, 1983
58.427
+6.065
11.58%
jan 1, 1984
62.209
+3.782
6.47%
jan 1, 1985
62.797
+0.588
0.95%
jan 1, 1986
63.983
+1.186
1.89%
jan 1, 1987
68.806
+4.823
7.54%
jan 1, 1988
72.225
+3.419
4.97%
jan 1, 1989
71.474
-0.751
-1.04%
jan 1, 1990
82.333
+10.859
15.19%
jan 1, 1991
67.851
-14.482
-17.59%
jan 1, 1992
72.501
+4.65
6.85%
jan 1, 1993
75.66
+3.159
4.36%
jan 1, 1994
77.881
+2.221
2.94%
jan 1, 1995
79.232
+1.351
1.73%
jan 1, 1996
75.148
-4.084
-5.15%
jan 1, 1997
76.168
+1.02
1.36%
jan 1, 1998
79.673
+3.506
4.6%
jan 1, 1999
80.857
+1.183
1.49%
jan 1, 2000
81.151
+0.295
0.36%
jan 1, 2001
77.494
-3.657
-4.51%
jan 1, 2002
74.065
-3.43
-4.43%
jan 1, 2003
73.755
-0.31
-0.42%
jan 1, 2004
72.856
-0.899
-1.22%
jan 1, 2005
71.609
-1.247
-1.71%
jan 1, 2006
70.652
-0.957
-1.34%
jan 1, 2007
69.172
-1.48
-2.09%
jan 1, 2008
66.724
-2.448
-3.54%
jan 1, 2009
67.151
+0.427
0.64%
jan 1, 2010
66.565
-0.586
-0.87%
jan 1, 2011
64.521
-2.044
-3.07%
jan 1, 2012
64.122
-0.399
-0.62%
jan 1, 2013
64.686
+0.564
0.88%
jan 1, 2014
62.27
-2.415
-3.73%
jan 1, 2015
62.298
+0.028
0.04%
Ranking of countries by current statistics by years


Comments: