29
/
en
AIzaSyAYiBZKx7MnpbEhh9jyipgxe19OcubqV5w
April 1, 2024
276889
United States
USA
true
2
1
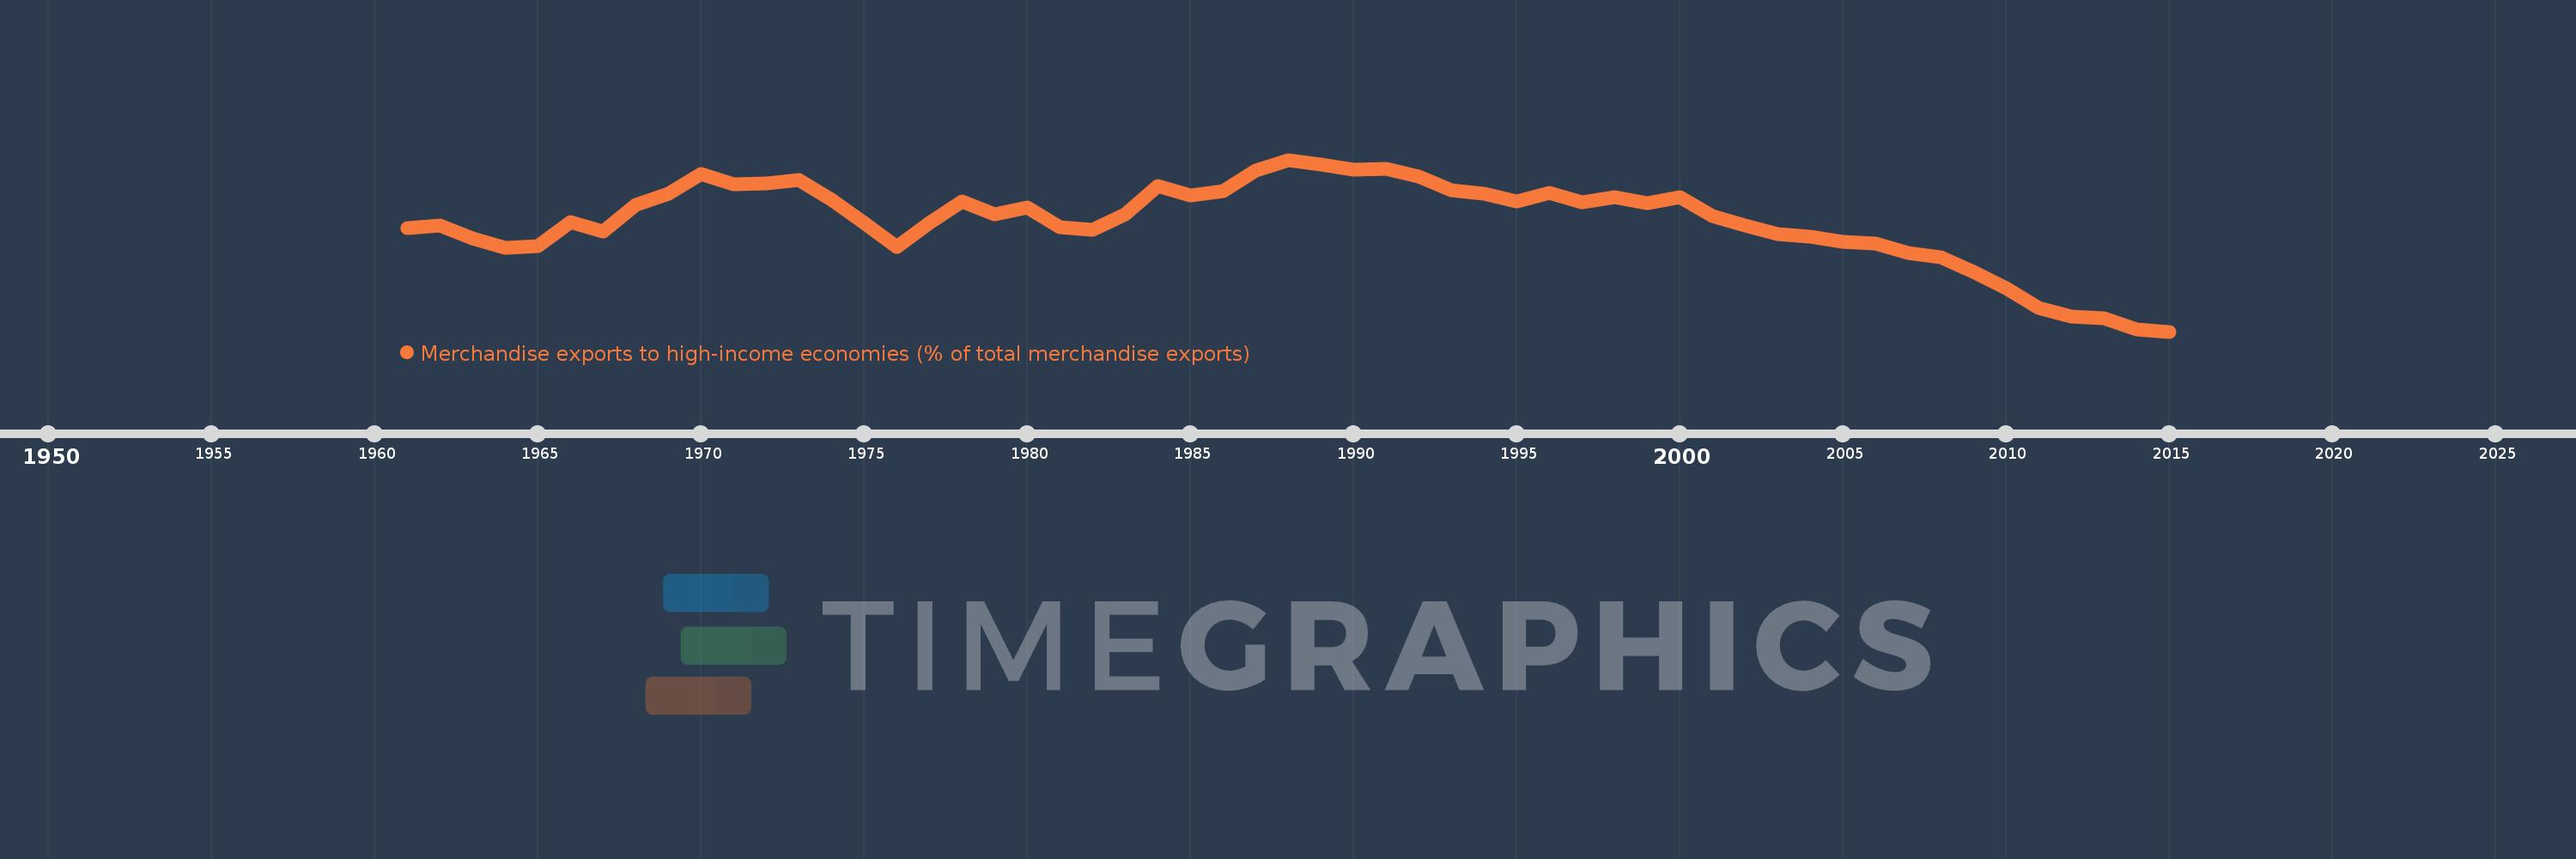
Merchandise exports to high-income economies (% of total merchandise exports)
2015,2014,2013,2012,2011,2010,2009,2008,2007,2006,2005,2004,2003,2002,2001,2000,1999,1998,1997,1996,1995,1994,1993,1992,1991,1990,1989,1988,1987,1986,1985,1984,1983,1982,1981,1980,1979,1978,1977,1976,1975,1974,1973,1972,1971,1970,1969,1968,1967,1966,1965,1964,1963,1962,1961
This statistics in other country:
AfghanistanAlbaniaAlgeriaAmerican SamoaAngolaAntigua and BarbudaArab WorldArgentinaArmeniaArubaAustraliaAustriaAzerbaijanBahamas, TheBahrainBangladeshBarbadosBelarusBelgiumBelizeBeninBermudaBoliviaBosnia and HerzegovinaBrazilBrunei DarussalamBulgariaBurkina FasoBurundiCabo VerdeCambodiaCameroonCanadaCaribbean small statesCentral African RepublicCentral Europe and the BalticsChadChileChinaColombiaComorosCongo, Dem. Rep.Congo, Rep.Costa RicaCote d'IvoireCroatiaCubaCyprusCzech RepublicDenmarkDjiboutiDominicaDominican RepublicEarly-demographic dividendEast Asia & PacificEast Asia & Pacific (excluding high income)East Asia & Pacific (IDA & IBRD countries)EcuadorEgypt, Arab Rep.El SalvadorEquatorial GuineaEstoniaEthiopiaEuro areaEurope & Central AsiaEurope & Central Asia (excluding high income)Europe & Central Asia (IDA & IBRD countries)European UnionFaroe IslandsFijiFinlandFragile and conflict affected situationsFranceFrench PolynesiaGabonGambia, TheGeorgiaGermanyGhanaGibraltarGreeceGreenlandGrenadaGuamGuatemalaGuineaGuinea-BissauGuyanaHaitiHeavily indebted poor countries (HIPC)High incomeHondurasHong Kong SAR, ChinaHungaryIBRD onlyIcelandIDA & IBRD totalIDA blendIDA onlyIDA totalIndiaIndonesiaIran, Islamic Rep.IraqIrelandIsraelItalyJamaicaJapanJordanKazakhstanKenyaKiribatiKorea, Dem. People’s Rep.Korea, Rep.KosovoKuwaitKyrgyz RepublicLao PDRLate-demographic dividendLatin America & Caribbean Latin America & Caribbean (excluding high income)Latin America & the Caribbean (IDA & IBRD countries)LatviaLeast developed countries: UN classificationLebanonLiberiaLibyaLithuaniaLow & middle incomeLow incomeLower middle incomeLuxembourgMacao SAR, ChinaMacedonia, FYRMadagascarMalawiMalaysiaMaldivesMaliMaltaMauritaniaMauritiusMexicoMiddle East & North AfricaMiddle East & North Africa (excluding high income)Middle East & North Africa (IDA & IBRD countries)Middle incomeMoldovaMongoliaMontenegroMoroccoMozambiqueMyanmarNauruNepalNetherlandsNew CaledoniaNew ZealandNicaraguaNigerNigeriaNorth AmericaNorwayOECD membersOmanOther small statesPacific island small statesPakistanPanamaPapua New GuineaParaguayPeruPhilippinesPolandPortugalPost-demographic dividendPre-demographic dividendQatarRomaniaRussian FederationRwandaSamoaSao Tome and PrincipeSaudi ArabiaSenegalSerbiaSeychellesSierra LeoneSingaporeSlovak RepublicSloveniaSmall statesSolomon IslandsSomaliaSouth AfricaSouth AsiaSouth Asia (IDA & IBRD)SpainSri LankaSt. Kitts and NevisSt. LuciaSt. Vincent and the GrenadinesSub-Saharan Africa Sub-Saharan Africa (excluding high income)Sub-Saharan Africa (IDA & IBRD countries)SudanSurinameSwedenSwitzerlandSyrian Arab RepublicTajikistanTanzaniaThailandTogoTongaTrinidad and TobagoTunisiaTurkeyTurkmenistanTuvaluUgandaUkraineUnited Arab EmiratesUnited KingdomUnited StatesUpper middle incomeUruguayUzbekistanVanuatuVenezuela, RBVietnamWorldYemen, Rep.ZambiaZimbabwe Timeline:
This timeline shows a graph from 1961 to 2015 of United States. No data until 1960. Number of actual observations by date: 55.
Source name:
World Development Indicators
Source organization:
World Bank staff estimates based data from International Monetary Fund's Direction of Trade database.
Categories, topics:
Private Sector, Trade
Last updated:
apr 23, 2017
Indicators value changes by year
Minimum:
60.751
jan 1, 2015
Maximum:
77.283
jan 1, 1988
At the date of observation
Value
Absolute change
Change from previous value
jan 1, 1961
70.72
+70.72
0.0%
jan 1, 1962
70.954
+0.234
0.33%
jan 1, 1963
69.732
-1.222
-1.72%
jan 1, 1964
68.848
-0.884
-1.27%
jan 1, 1965
69.009
+0.161
0.23%
jan 1, 1966
71.299
+2.291
3.32%
jan 1, 1967
70.406
-0.894
-1.25%
jan 1, 1968
72.951
+2.545
3.61%
jan 1, 1969
74.033
+1.083
1.48%
jan 1, 1970
75.911
+1.878
2.54%
jan 1, 1971
74.934
-0.977
-1.29%
jan 1, 1972
74.984
+0.05
0.07%
jan 1, 1973
75.337
+0.353
0.47%
jan 1, 1974
73.45
-1.888
-2.51%
jan 1, 1975
71.234
-2.215
-3.02%
jan 1, 1976
68.875
-2.36
-3.31%
jan 1, 1977
71.223
+2.348
3.41%
jan 1, 1978
73.261
+2.038
2.86%
jan 1, 1979
72.065
-1.195
-1.63%
jan 1, 1980
72.693
+0.628
0.87%
jan 1, 1981
70.815
-1.878
-2.58%
jan 1, 1982
70.518
-0.297
-0.42%
jan 1, 1983
72.023
+1.505
2.13%
jan 1, 1984
74.721
+2.697
3.74%
jan 1, 1985
73.866
-0.855
-1.14%
jan 1, 1986
74.26
+0.394
0.53%
jan 1, 1987
76.274
+2.014
2.71%
jan 1, 1988
77.283
+1.009
1.32%
jan 1, 1989
76.827
-0.456
-0.59%
jan 1, 1990
76.367
-0.46
-0.6%
jan 1, 1991
76.392
+0.025
0.03%
jan 1, 1992
75.667
-0.725
-0.95%
jan 1, 1993
74.34
-1.326
-1.75%
jan 1, 1994
73.985
-0.355
-0.48%
jan 1, 1995
73.28
-0.705
-0.95%
jan 1, 1996
74.066
+0.786
1.07%
jan 1, 1997
73.16
-0.906
-1.22%
jan 1, 1998
73.659
+0.499
0.68%
jan 1, 1999
73.097
-0.562
-0.76%
jan 1, 2000
73.718
+0.621
0.85%
jan 1, 2001
71.832
-1.886
-2.56%
jan 1, 2002
70.979
-0.853
-1.19%
jan 1, 2003
70.092
-0.887
-1.25%
jan 1, 2004
69.873
-0.219
-0.31%
jan 1, 2005
69.394
-0.479
-0.69%
jan 1, 2006
69.256
-0.137
-0.2%
jan 1, 2007
68.283
-0.974
-1.41%
jan 1, 2008
67.933
-0.35
-0.51%
jan 1, 2009
66.511
-1.422
-2.09%
jan 1, 2010
64.905
-1.605
-2.41%
jan 1, 2011
62.991
-1.914
-2.95%
jan 1, 2012
62.206
-0.786
-1.25%
jan 1, 2013
62.059
-0.146
-0.24%
jan 1, 2014
60.934
-1.125
-1.81%
jan 1, 2015
60.751
-0.183
-0.3%
Ranking of countries by current statistics by years


Comments: