29
/
en
AIzaSyAYiBZKx7MnpbEhh9jyipgxe19OcubqV5w
April 1, 2024
268267
Tunisia
TUN
true
2
1
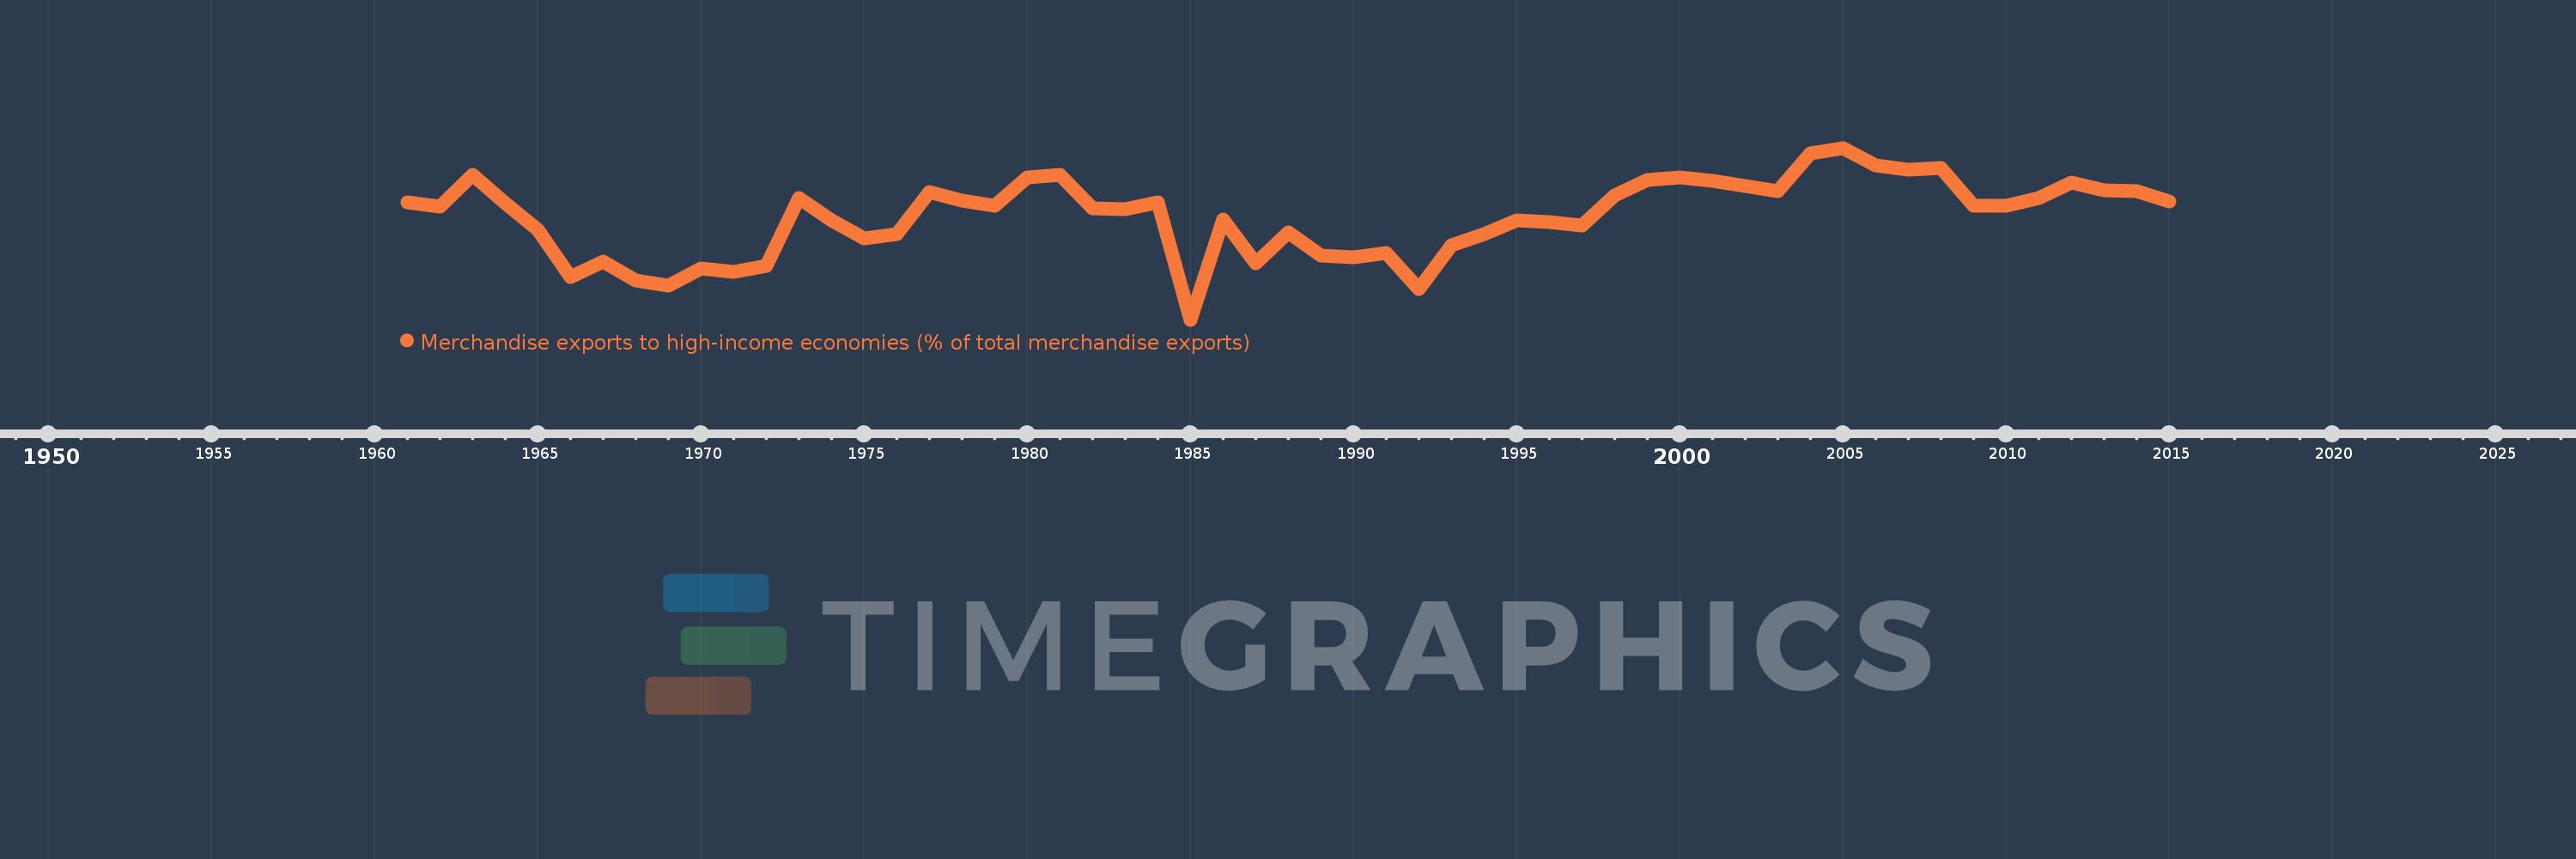
Merchandise exports to high-income economies (% of total merchandise exports)
2015,2014,2013,2012,2011,2010,2009,2008,2007,2006,2005,2004,2003,2002,2001,2000,1999,1998,1997,1996,1995,1994,1993,1992,1991,1990,1989,1988,1987,1986,1985,1984,1983,1982,1981,1980,1979,1978,1977,1976,1975,1974,1973,1972,1971,1970,1969,1968,1967,1966,1965,1964,1963,1962,1961
This statistics in other country:
AfghanistanAlbaniaAlgeriaAmerican SamoaAngolaAntigua and BarbudaArab WorldArgentinaArmeniaArubaAustraliaAustriaAzerbaijanBahamas, TheBahrainBangladeshBarbadosBelarusBelgiumBelizeBeninBermudaBoliviaBosnia and HerzegovinaBrazilBrunei DarussalamBulgariaBurkina FasoBurundiCabo VerdeCambodiaCameroonCanadaCaribbean small statesCentral African RepublicCentral Europe and the BalticsChadChileChinaColombiaComorosCongo, Dem. Rep.Congo, Rep.Costa RicaCote d'IvoireCroatiaCubaCyprusCzech RepublicDenmarkDjiboutiDominicaDominican RepublicEarly-demographic dividendEast Asia & PacificEast Asia & Pacific (excluding high income)East Asia & Pacific (IDA & IBRD countries)EcuadorEgypt, Arab Rep.El SalvadorEquatorial GuineaEstoniaEthiopiaEuro areaEurope & Central AsiaEurope & Central Asia (excluding high income)Europe & Central Asia (IDA & IBRD countries)European UnionFaroe IslandsFijiFinlandFragile and conflict affected situationsFranceFrench PolynesiaGabonGambia, TheGeorgiaGermanyGhanaGibraltarGreeceGreenlandGrenadaGuamGuatemalaGuineaGuinea-BissauGuyanaHaitiHeavily indebted poor countries (HIPC)High incomeHondurasHong Kong SAR, ChinaHungaryIBRD onlyIcelandIDA & IBRD totalIDA blendIDA onlyIDA totalIndiaIndonesiaIran, Islamic Rep.IraqIrelandIsraelItalyJamaicaJapanJordanKazakhstanKenyaKiribatiKorea, Dem. People’s Rep.Korea, Rep.KosovoKuwaitKyrgyz RepublicLao PDRLate-demographic dividendLatin America & Caribbean Latin America & Caribbean (excluding high income)Latin America & the Caribbean (IDA & IBRD countries)LatviaLeast developed countries: UN classificationLebanonLiberiaLibyaLithuaniaLow & middle incomeLow incomeLower middle incomeLuxembourgMacao SAR, ChinaMacedonia, FYRMadagascarMalawiMalaysiaMaldivesMaliMaltaMauritaniaMauritiusMexicoMiddle East & North AfricaMiddle East & North Africa (excluding high income)Middle East & North Africa (IDA & IBRD countries)Middle incomeMoldovaMongoliaMontenegroMoroccoMozambiqueMyanmarNauruNepalNetherlandsNew CaledoniaNew ZealandNicaraguaNigerNigeriaNorth AmericaNorwayOECD membersOmanOther small statesPacific island small statesPakistanPanamaPapua New GuineaParaguayPeruPhilippinesPolandPortugalPost-demographic dividendPre-demographic dividendQatarRomaniaRussian FederationRwandaSamoaSao Tome and PrincipeSaudi ArabiaSenegalSerbiaSeychellesSierra LeoneSingaporeSlovak RepublicSloveniaSmall statesSolomon IslandsSomaliaSouth AfricaSouth AsiaSouth Asia (IDA & IBRD)SpainSri LankaSt. Kitts and NevisSt. LuciaSt. Vincent and the GrenadinesSub-Saharan Africa Sub-Saharan Africa (excluding high income)Sub-Saharan Africa (IDA & IBRD countries)SudanSurinameSwedenSwitzerlandSyrian Arab RepublicTajikistanTanzaniaThailandTogoTongaTrinidad and TobagoTunisiaTurkeyTurkmenistanTuvaluUgandaUkraineUnited Arab EmiratesUnited KingdomUnited StatesUpper middle incomeUruguayUzbekistanVanuatuVenezuela, RBVietnamWorldYemen, Rep.ZambiaZimbabwe Timeline:
This timeline shows a graph from 1961 to 2015 of Tunisia. No data until 1960. Number of actual observations by date: 55.
Source name:
World Development Indicators
Source organization:
World Bank staff estimates based data from International Monetary Fund's Direction of Trade database.
Categories, topics:
Private Sector, Trade
Last updated:
apr 23, 2017
Indicators value changes by year
Minimum:
62.551
jan 1, 1985
Maximum:
88.765
jan 1, 2005
At the date of observation
Value
Absolute change
Change from previous value
jan 1, 1961
80.418
+80.418
0.0%
jan 1, 1962
79.782
-0.636
-0.79%
jan 1, 1963
84.702
+4.919
6.17%
jan 1, 1964
80.303
-4.399
-5.19%
jan 1, 1965
76.32
-3.983
-4.96%
jan 1, 1966
69.058
-7.262
-9.52%
jan 1, 1967
71.469
+2.412
3.49%
jan 1, 1968
68.562
-2.907
-4.07%
jan 1, 1969
67.774
-0.788
-1.15%
jan 1, 1970
70.354
+2.579
3.81%
jan 1, 1971
69.794
-0.56
-0.8%
jan 1, 1972
70.718
+0.924
1.32%
jan 1, 1973
81.175
+10.457
14.79%
jan 1, 1974
77.693
-3.483
-4.29%
jan 1, 1975
75.015
-2.678
-3.45%
jan 1, 1976
75.675
+0.66
0.88%
jan 1, 1977
82.014
+6.339
8.38%
jan 1, 1978
80.768
-1.246
-1.52%
jan 1, 1979
79.996
-0.772
-0.96%
jan 1, 1980
84.233
+4.237
5.3%
jan 1, 1981
84.708
+0.475
0.56%
jan 1, 1982
79.549
-5.16
-6.09%
jan 1, 1983
79.395
-0.154
-0.19%
jan 1, 1984
80.445
+1.05
1.32%
jan 1, 1985
62.551
-17.894
-22.24%
jan 1, 1986
77.808
+15.257
24.39%
jan 1, 1987
71.164
-6.644
-8.54%
jan 1, 1988
75.902
+4.738
6.66%
jan 1, 1989
72.366
-3.536
-4.66%
jan 1, 1990
72.138
-0.228
-0.32%
jan 1, 1991
72.788
+0.65
0.9%
jan 1, 1992
67.178
-5.61
-7.71%
jan 1, 1993
73.928
+6.75
10.05%
jan 1, 1994
75.636
+1.709
2.31%
jan 1, 1995
77.774
+2.137
2.83%
jan 1, 1996
77.437
-0.336
-0.43%
jan 1, 1997
76.919
-0.518
-0.67%
jan 1, 1998
81.511
+4.592
5.97%
jan 1, 1999
83.915
+2.404
2.95%
jan 1, 2000
84.266
+0.351
0.42%
jan 1, 2001
83.714
-0.552
-0.66%
jan 1, 2002
83.012
-0.702
-0.84%
jan 1, 2003
82.196
-0.816
-0.98%
jan 1, 2004
87.882
+5.685
6.92%
jan 1, 2005
88.765
+0.883
1.0%
jan 1, 2006
86.078
-2.687
-3.03%
jan 1, 2007
85.458
-0.62
-0.72%
jan 1, 2008
85.667
+0.208
0.24%
jan 1, 2009
79.942
-5.724
-6.68%
jan 1, 2010
79.986
+0.044
0.06%
jan 1, 2011
81.16
+1.173
1.47%
jan 1, 2012
83.426
+2.266
2.79%
jan 1, 2013
82.325
-1.101
-1.32%
jan 1, 2014
82.221
-0.104
-0.13%
jan 1, 2015
80.596
-1.625
-1.98%
Ranking of countries by current statistics by years


Comments: