29
/
en
AIzaSyAYiBZKx7MnpbEhh9jyipgxe19OcubqV5w
April 1, 2024
149375
Haiti
HTI
true
2
1
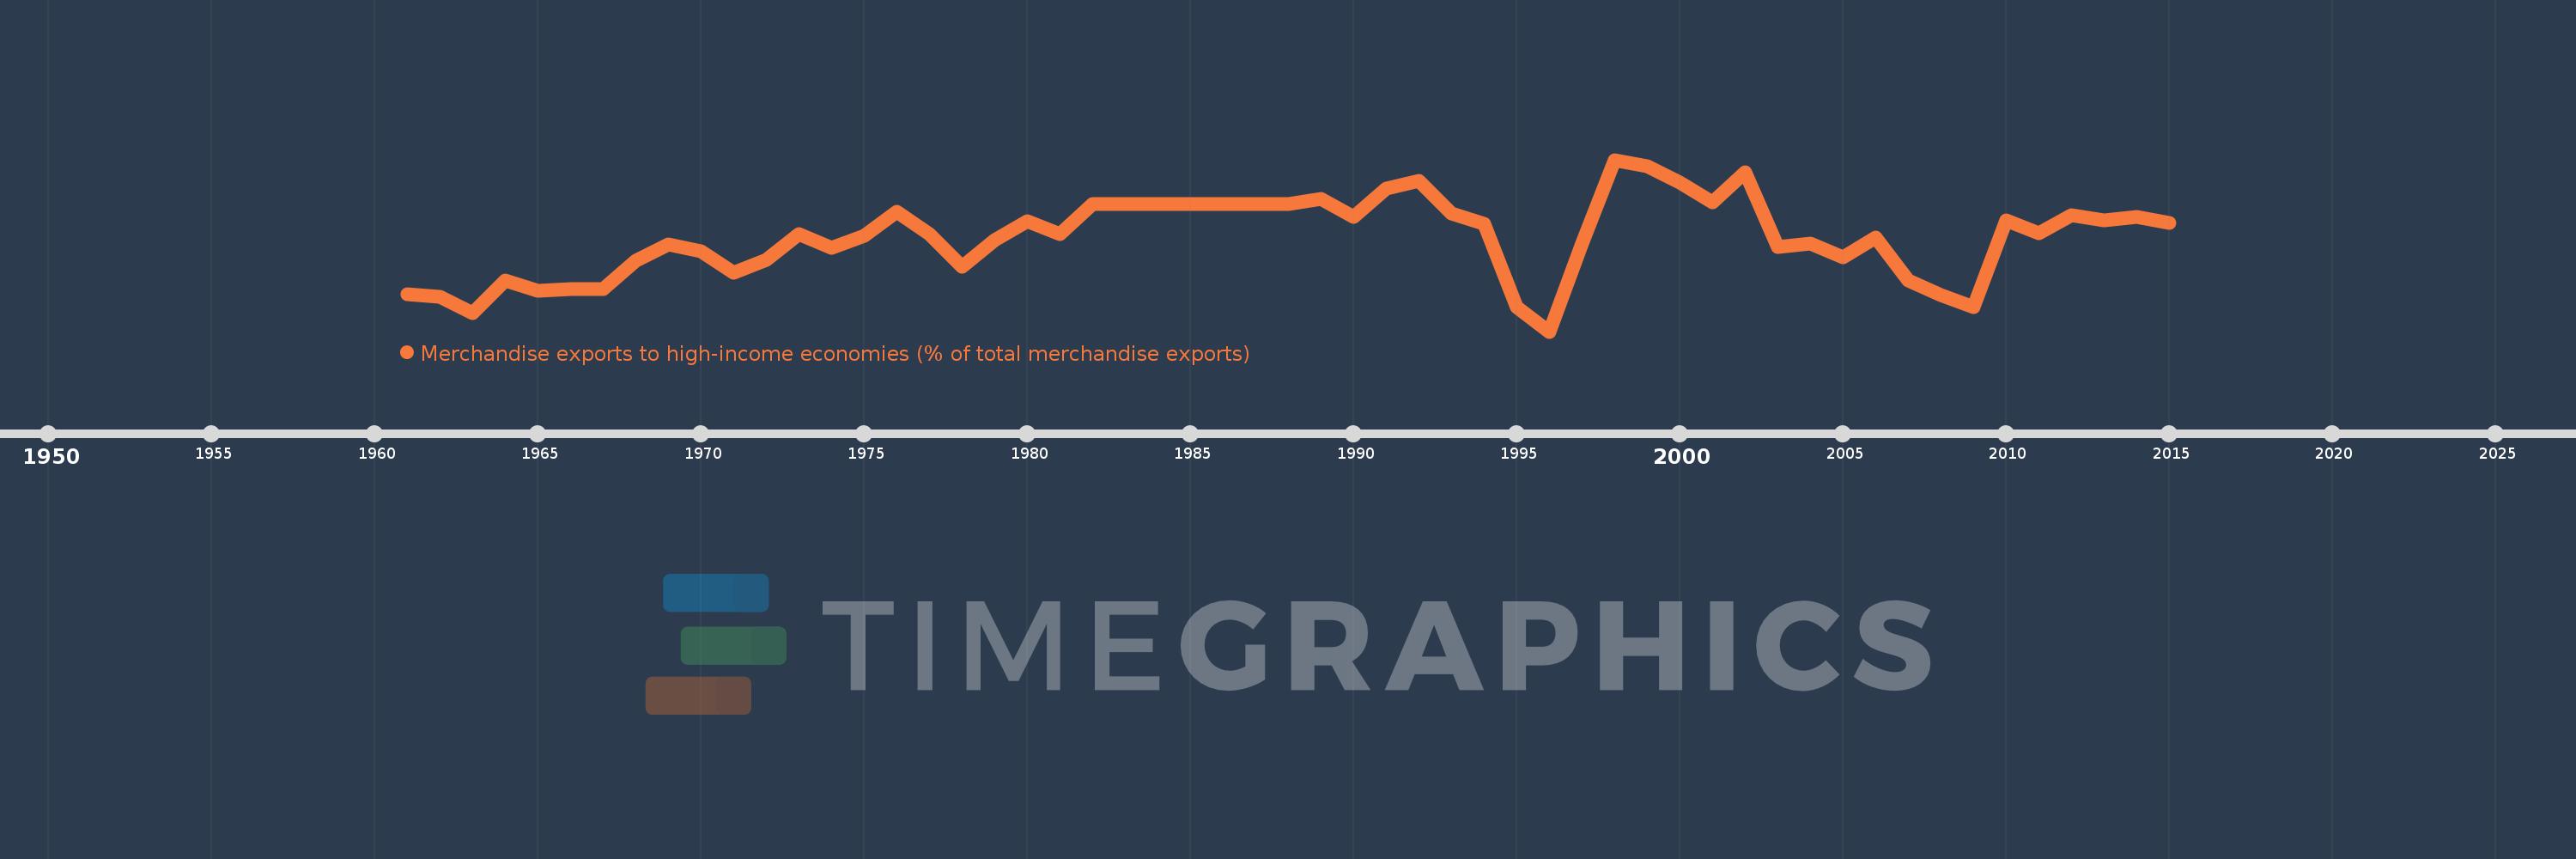
Merchandise exports to high-income economies (% of total merchandise exports)
2015,2014,2013,2012,2011,2010,2009,2008,2007,2006,2005,2004,2003,2002,2001,2000,1999,1998,1997,1996,1995,1994,1993,1992,1991,1990,1989,1988,1987,1986,1985,1984,1983,1982,1981,1980,1979,1978,1977,1976,1975,1974,1973,1972,1971,1970,1969,1968,1967,1966,1965,1964,1963,1962,1961
This statistics in other country:
AfghanistanAlbaniaAlgeriaAmerican SamoaAngolaAntigua and BarbudaArab WorldArgentinaArmeniaArubaAustraliaAustriaAzerbaijanBahamas, TheBahrainBangladeshBarbadosBelarusBelgiumBelizeBeninBermudaBoliviaBosnia and HerzegovinaBrazilBrunei DarussalamBulgariaBurkina FasoBurundiCabo VerdeCambodiaCameroonCanadaCaribbean small statesCentral African RepublicCentral Europe and the BalticsChadChileChinaColombiaComorosCongo, Dem. Rep.Congo, Rep.Costa RicaCote d'IvoireCroatiaCubaCyprusCzech RepublicDenmarkDjiboutiDominicaDominican RepublicEarly-demographic dividendEast Asia & PacificEast Asia & Pacific (excluding high income)East Asia & Pacific (IDA & IBRD countries)EcuadorEgypt, Arab Rep.El SalvadorEquatorial GuineaEstoniaEthiopiaEuro areaEurope & Central AsiaEurope & Central Asia (excluding high income)Europe & Central Asia (IDA & IBRD countries)European UnionFaroe IslandsFijiFinlandFragile and conflict affected situationsFranceFrench PolynesiaGabonGambia, TheGeorgiaGermanyGhanaGibraltarGreeceGreenlandGrenadaGuamGuatemalaGuineaGuinea-BissauGuyanaHaitiHeavily indebted poor countries (HIPC)High incomeHondurasHong Kong SAR, ChinaHungaryIBRD onlyIcelandIDA & IBRD totalIDA blendIDA onlyIDA totalIndiaIndonesiaIran, Islamic Rep.IraqIrelandIsraelItalyJamaicaJapanJordanKazakhstanKenyaKiribatiKorea, Dem. People’s Rep.Korea, Rep.KosovoKuwaitKyrgyz RepublicLao PDRLate-demographic dividendLatin America & Caribbean Latin America & Caribbean (excluding high income)Latin America & the Caribbean (IDA & IBRD countries)LatviaLeast developed countries: UN classificationLebanonLiberiaLibyaLithuaniaLow & middle incomeLow incomeLower middle incomeLuxembourgMacao SAR, ChinaMacedonia, FYRMadagascarMalawiMalaysiaMaldivesMaliMaltaMauritaniaMauritiusMexicoMiddle East & North AfricaMiddle East & North Africa (excluding high income)Middle East & North Africa (IDA & IBRD countries)Middle incomeMoldovaMongoliaMontenegroMoroccoMozambiqueMyanmarNauruNepalNetherlandsNew CaledoniaNew ZealandNicaraguaNigerNigeriaNorth AmericaNorwayOECD membersOmanOther small statesPacific island small statesPakistanPanamaPapua New GuineaParaguayPeruPhilippinesPolandPortugalPost-demographic dividendPre-demographic dividendQatarRomaniaRussian FederationRwandaSamoaSao Tome and PrincipeSaudi ArabiaSenegalSerbiaSeychellesSierra LeoneSingaporeSlovak RepublicSloveniaSmall statesSolomon IslandsSomaliaSouth AfricaSouth AsiaSouth Asia (IDA & IBRD)SpainSri LankaSt. Kitts and NevisSt. LuciaSt. Vincent and the GrenadinesSub-Saharan Africa Sub-Saharan Africa (excluding high income)Sub-Saharan Africa (IDA & IBRD countries)SudanSurinameSwedenSwitzerlandSyrian Arab RepublicTajikistanTanzaniaThailandTogoTongaTrinidad and TobagoTunisiaTurkeyTurkmenistanTuvaluUgandaUkraineUnited Arab EmiratesUnited KingdomUnited StatesUpper middle incomeUruguayUzbekistanVanuatuVenezuela, RBVietnamWorldYemen, Rep.ZambiaZimbabwe Timeline:
This timeline shows a graph from 1961 to 2015 of Haiti. No data until 1960. Number of actual observations by date: 55.
Source name:
World Development Indicators
Source organization:
World Bank staff estimates based data from International Monetary Fund's Direction of Trade database.
Categories, topics:
Private Sector, Trade
Last updated:
apr 23, 2017
Indicators value changes by year
Minimum:
80.864
jan 1, 1996
Maximum:
99.271
jan 1, 1998
At the date of observation
Value
Absolute change
Change from previous value
jan 1, 1961
84.883
+84.883
0.0%
jan 1, 1962
84.633
-0.25
-0.29%
jan 1, 1963
82.888
-1.745
-2.06%
jan 1, 1964
86.374
+3.487
4.21%
jan 1, 1965
85.224
-1.15
-1.33%
jan 1, 1966
85.451
+0.227
0.27%
jan 1, 1967
85.437
-0.014
-0.02%
jan 1, 1968
88.501
+3.064
3.59%
jan 1, 1969
90.206
+1.704
1.93%
jan 1, 1970
89.499
-0.706
-0.78%
jan 1, 1971
87.183
-2.316
-2.59%
jan 1, 1972
88.516
+1.333
1.53%
jan 1, 1973
91.287
+2.771
3.13%
jan 1, 1974
89.82
-1.467
-1.61%
jan 1, 1975
91.106
+1.286
1.43%
jan 1, 1976
93.711
+2.604
2.86%
jan 1, 1977
91.336
-2.375
-2.53%
jan 1, 1978
87.799
-3.537
-3.87%
jan 1, 1979
90.68
+2.882
3.28%
jan 1, 1980
92.661
+1.98
2.18%
jan 1, 1981
91.344
-1.317
-1.42%
jan 1, 1982
94.552
+3.209
3.51%
jan 1, 1983
94.552
0.0
0.0%
jan 1, 1984
94.552
+0.0
0.0%
jan 1, 1985
94.552
0.0
0.0%
jan 1, 1986
94.552
+0.0
0.0%
jan 1, 1987
94.552
0.0
0.0%
jan 1, 1988
94.552
+0.0
0.0%
jan 1, 1989
95.054
+0.502
0.53%
jan 1, 1990
93.17
-1.884
-1.98%
jan 1, 1991
96.225
+3.055
3.28%
jan 1, 1992
96.996
+0.771
0.8%
jan 1, 1993
93.543
-3.453
-3.56%
jan 1, 1994
92.445
-1.098
-1.17%
jan 1, 1995
83.528
-8.917
-9.65%
jan 1, 1996
80.864
-2.664
-3.19%
jan 1, 1997
90.279
+9.415
11.64%
jan 1, 1998
99.271
+8.992
9.96%
jan 1, 1999
98.589
-0.682
-0.69%
jan 1, 2000
96.868
-1.721
-1.75%
jan 1, 2001
94.749
-2.12
-2.19%
jan 1, 2002
97.957
+3.208
3.39%
jan 1, 2003
89.895
-8.062
-8.23%
jan 1, 2004
90.299
+0.404
0.45%
jan 1, 2005
88.851
-1.448
-1.6%
jan 1, 2006
90.909
+2.058
2.32%
jan 1, 2007
86.338
-4.571
-5.03%
jan 1, 2008
84.734
-1.604
-1.86%
jan 1, 2009
83.476
-1.259
-1.49%
jan 1, 2010
92.823
+9.347
11.2%
jan 1, 2011
91.415
-1.408
-1.52%
jan 1, 2012
93.327
+1.912
2.09%
jan 1, 2013
92.756
-0.57
-0.61%
jan 1, 2014
93.175
+0.419
0.45%
jan 1, 2015
92.517
-0.657
-0.71%
Ranking of countries by current statistics by years


Comments: