29
/
en
AIzaSyAYiBZKx7MnpbEhh9jyipgxe19OcubqV5w
April 1, 2024
227637
Qatar
QAT
true
2
1
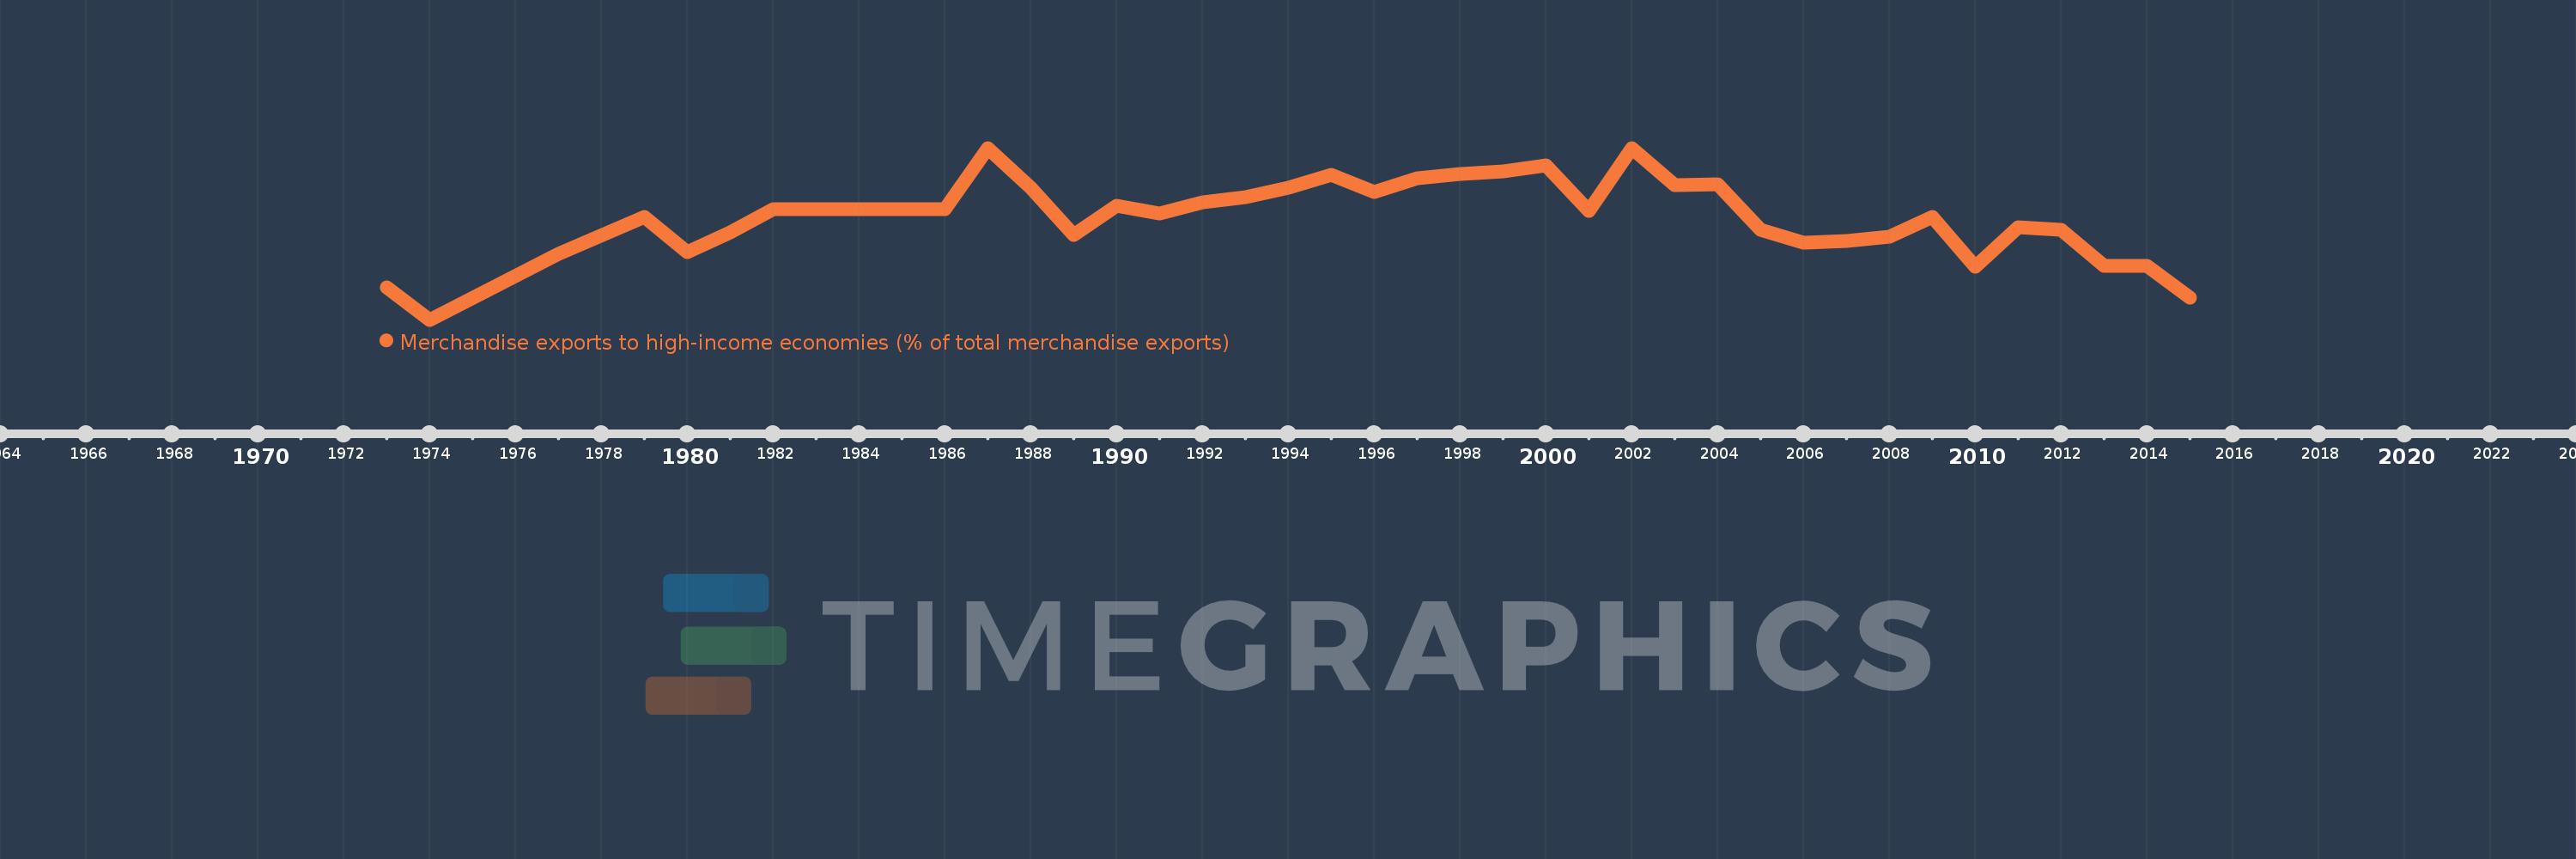
Merchandise exports to high-income economies (% of total merchandise exports)
2015,2014,2013,2012,2011,2010,2009,2008,2007,2006,2005,2004,2003,2002,2001,2000,1999,1998,1997,1996,1995,1994,1993,1992,1991,1990,1989,1988,1987,1986,1985,1984,1983,1982,1981,1980,1979,1977,1974,1973
This statistics in other country:
AfghanistanAlbaniaAlgeriaAmerican SamoaAngolaAntigua and BarbudaArab WorldArgentinaArmeniaArubaAustraliaAustriaAzerbaijanBahamas, TheBahrainBangladeshBarbadosBelarusBelgiumBelizeBeninBermudaBoliviaBosnia and HerzegovinaBrazilBrunei DarussalamBulgariaBurkina FasoBurundiCabo VerdeCambodiaCameroonCanadaCaribbean small statesCentral African RepublicCentral Europe and the BalticsChadChileChinaColombiaComorosCongo, Dem. Rep.Congo, Rep.Costa RicaCote d'IvoireCroatiaCubaCyprusCzech RepublicDenmarkDjiboutiDominicaDominican RepublicEarly-demographic dividendEast Asia & PacificEast Asia & Pacific (excluding high income)East Asia & Pacific (IDA & IBRD countries)EcuadorEgypt, Arab Rep.El SalvadorEquatorial GuineaEstoniaEthiopiaEuro areaEurope & Central AsiaEurope & Central Asia (excluding high income)Europe & Central Asia (IDA & IBRD countries)European UnionFaroe IslandsFijiFinlandFragile and conflict affected situationsFranceFrench PolynesiaGabonGambia, TheGeorgiaGermanyGhanaGibraltarGreeceGreenlandGrenadaGuamGuatemalaGuineaGuinea-BissauGuyanaHaitiHeavily indebted poor countries (HIPC)High incomeHondurasHong Kong SAR, ChinaHungaryIBRD onlyIcelandIDA & IBRD totalIDA blendIDA onlyIDA totalIndiaIndonesiaIran, Islamic Rep.IraqIrelandIsraelItalyJamaicaJapanJordanKazakhstanKenyaKiribatiKorea, Dem. People’s Rep.Korea, Rep.KosovoKuwaitKyrgyz RepublicLao PDRLate-demographic dividendLatin America & Caribbean Latin America & Caribbean (excluding high income)Latin America & the Caribbean (IDA & IBRD countries)LatviaLeast developed countries: UN classificationLebanonLiberiaLibyaLithuaniaLow & middle incomeLow incomeLower middle incomeLuxembourgMacao SAR, ChinaMacedonia, FYRMadagascarMalawiMalaysiaMaldivesMaliMaltaMauritaniaMauritiusMexicoMiddle East & North AfricaMiddle East & North Africa (excluding high income)Middle East & North Africa (IDA & IBRD countries)Middle incomeMoldovaMongoliaMontenegroMoroccoMozambiqueMyanmarNauruNepalNetherlandsNew CaledoniaNew ZealandNicaraguaNigerNigeriaNorth AmericaNorwayOECD membersOmanOther small statesPacific island small statesPakistanPanamaPapua New GuineaParaguayPeruPhilippinesPolandPortugalPost-demographic dividendPre-demographic dividendQatarRomaniaRussian FederationRwandaSamoaSao Tome and PrincipeSaudi ArabiaSenegalSerbiaSeychellesSierra LeoneSingaporeSlovak RepublicSloveniaSmall statesSolomon IslandsSomaliaSouth AfricaSouth AsiaSouth Asia (IDA & IBRD)SpainSri LankaSt. Kitts and NevisSt. LuciaSt. Vincent and the GrenadinesSub-Saharan Africa Sub-Saharan Africa (excluding high income)Sub-Saharan Africa (IDA & IBRD countries)SudanSurinameSwedenSwitzerlandSyrian Arab RepublicTajikistanTanzaniaThailandTogoTongaTrinidad and TobagoTunisiaTurkeyTurkmenistanTuvaluUgandaUkraineUnited Arab EmiratesUnited KingdomUnited StatesUpper middle incomeUruguayUzbekistanVanuatuVenezuela, RBVietnamWorldYemen, Rep.ZambiaZimbabwe Timeline:
This timeline shows a graph from 1973 to 2015 of Qatar. No data until 1972. Number of actual observations by date: 40.
Source name:
World Development Indicators
Source organization:
World Bank staff estimates based data from International Monetary Fund's Direction of Trade database.
Categories, topics:
Private Sector, Trade
Last updated:
apr 23, 2017
Indicators value changes by year
Minimum:
67.514
jan 1, 1974
At the date of observation
Value
Absolute change
Change from previous value
jan 1, 1973
71.45
+71.45
0.0%
jan 1, 1974
67.514
-3.936
-5.51%
jan 1, 1977
75.643
+8.129
12.04%
jan 1, 1979
80.095
+4.452
5.89%
jan 1, 1980
75.864
-4.231
-5.28%
jan 1, 1981
78.209
+2.346
3.09%
jan 1, 1982
81.124
+2.915
3.73%
jan 1, 1983
81.124
0.0
0.0%
jan 1, 1984
81.124
+0.0
0.0%
jan 1, 1985
81.124
0.0
0.0%
jan 1, 1986
81.124
0.0
0.0%
jan 1, 1987
88.55
+7.426
9.15%
jan 1, 1988
83.714
-4.836
-5.46%
jan 1, 1989
77.955
-5.759
-6.88%
jan 1, 1990
81.553
+3.598
4.62%
jan 1, 1991
80.593
-0.96
-1.18%
jan 1, 1992
81.974
+1.381
1.71%
jan 1, 1993
82.536
+0.561
0.68%
jan 1, 1994
83.76
+1.224
1.48%
jan 1, 1995
85.32
+1.56
1.86%
jan 1, 1996
83.176
-2.144
-2.51%
jan 1, 1997
84.86
+1.684
2.02%
jan 1, 1998
85.406
+0.546
0.64%
jan 1, 1999
85.73
+0.324
0.38%
jan 1, 2000
86.486
+0.755
0.88%
jan 1, 2001
80.858
-5.627
-6.51%
jan 1, 2002
88.61
+7.752
9.59%
jan 1, 2003
84.057
-4.554
-5.14%
jan 1, 2004
84.139
+0.083
0.1%
jan 1, 2005
78.51
-5.63
-6.69%
jan 1, 2006
76.957
-1.552
-1.98%
jan 1, 2007
77.158
+0.2
0.26%
jan 1, 2008
77.754
+0.596
0.77%
jan 1, 2009
80.175
+2.421
3.11%
jan 1, 2010
73.985
-6.19
-7.72%
jan 1, 2011
78.921
+4.936
6.67%
jan 1, 2012
78.511
-0.41
-0.52%
jan 1, 2013
74.149
-4.362
-5.56%
jan 1, 2014
74.106
-0.043
-0.06%
jan 1, 2015
70.238
-3.868
-5.22%
Ranking of countries by current statistics by years


Comments: