29
/
en
AIzaSyAYiBZKx7MnpbEhh9jyipgxe19OcubqV5w
April 1, 2024
70094
Argentina
ARG
true
2
1
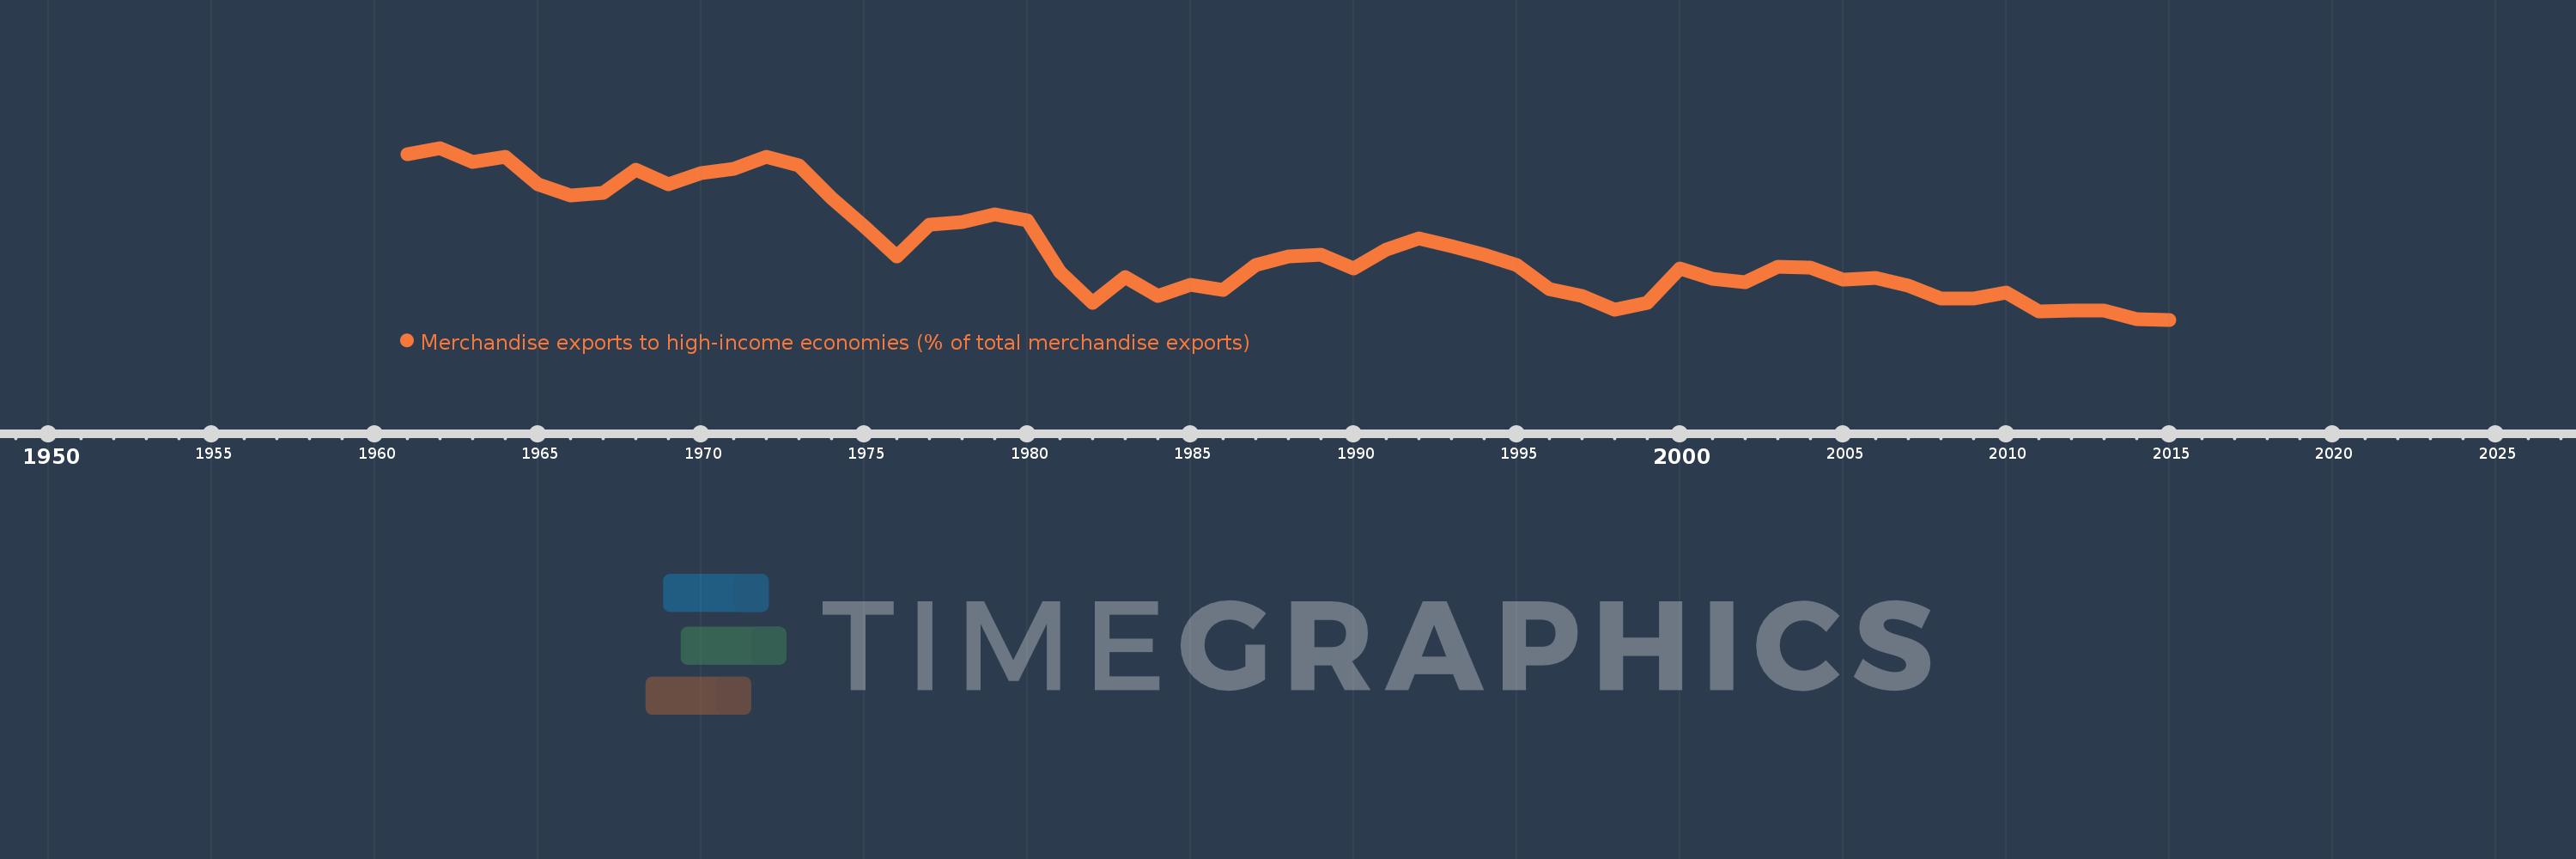
Merchandise exports to high-income economies (% of total merchandise exports)
2015,2014,2013,2012,2011,2010,2009,2008,2007,2006,2005,2004,2003,2002,2001,2000,1999,1998,1997,1996,1995,1994,1993,1992,1991,1990,1989,1988,1987,1986,1985,1984,1983,1982,1981,1980,1979,1978,1977,1976,1975,1974,1973,1972,1971,1970,1969,1968,1967,1966,1965,1964,1963,1962,1961
This statistics in other country:
AfghanistanAlbaniaAlgeriaAmerican SamoaAngolaAntigua and BarbudaArab WorldArgentinaArmeniaArubaAustraliaAustriaAzerbaijanBahamas, TheBahrainBangladeshBarbadosBelarusBelgiumBelizeBeninBermudaBoliviaBosnia and HerzegovinaBrazilBrunei DarussalamBulgariaBurkina FasoBurundiCabo VerdeCambodiaCameroonCanadaCaribbean small statesCentral African RepublicCentral Europe and the BalticsChadChileChinaColombiaComorosCongo, Dem. Rep.Congo, Rep.Costa RicaCote d'IvoireCroatiaCubaCyprusCzech RepublicDenmarkDjiboutiDominicaDominican RepublicEarly-demographic dividendEast Asia & PacificEast Asia & Pacific (excluding high income)East Asia & Pacific (IDA & IBRD countries)EcuadorEgypt, Arab Rep.El SalvadorEquatorial GuineaEstoniaEthiopiaEuro areaEurope & Central AsiaEurope & Central Asia (excluding high income)Europe & Central Asia (IDA & IBRD countries)European UnionFaroe IslandsFijiFinlandFragile and conflict affected situationsFranceFrench PolynesiaGabonGambia, TheGeorgiaGermanyGhanaGibraltarGreeceGreenlandGrenadaGuamGuatemalaGuineaGuinea-BissauGuyanaHaitiHeavily indebted poor countries (HIPC)High incomeHondurasHong Kong SAR, ChinaHungaryIBRD onlyIcelandIDA & IBRD totalIDA blendIDA onlyIDA totalIndiaIndonesiaIran, Islamic Rep.IraqIrelandIsraelItalyJamaicaJapanJordanKazakhstanKenyaKiribatiKorea, Dem. People’s Rep.Korea, Rep.KosovoKuwaitKyrgyz RepublicLao PDRLate-demographic dividendLatin America & Caribbean Latin America & Caribbean (excluding high income)Latin America & the Caribbean (IDA & IBRD countries)LatviaLeast developed countries: UN classificationLebanonLiberiaLibyaLithuaniaLow & middle incomeLow incomeLower middle incomeLuxembourgMacao SAR, ChinaMacedonia, FYRMadagascarMalawiMalaysiaMaldivesMaliMaltaMauritaniaMauritiusMexicoMiddle East & North AfricaMiddle East & North Africa (excluding high income)Middle East & North Africa (IDA & IBRD countries)Middle incomeMoldovaMongoliaMontenegroMoroccoMozambiqueMyanmarNauruNepalNetherlandsNew CaledoniaNew ZealandNicaraguaNigerNigeriaNorth AmericaNorwayOECD membersOmanOther small statesPacific island small statesPakistanPanamaPapua New GuineaParaguayPeruPhilippinesPolandPortugalPost-demographic dividendPre-demographic dividendQatarRomaniaRussian FederationRwandaSamoaSao Tome and PrincipeSaudi ArabiaSenegalSerbiaSeychellesSierra LeoneSingaporeSlovak RepublicSloveniaSmall statesSolomon IslandsSomaliaSouth AfricaSouth AsiaSouth Asia (IDA & IBRD)SpainSri LankaSt. Kitts and NevisSt. LuciaSt. Vincent and the GrenadinesSub-Saharan Africa Sub-Saharan Africa (excluding high income)Sub-Saharan Africa (IDA & IBRD countries)SudanSurinameSwedenSwitzerlandSyrian Arab RepublicTajikistanTanzaniaThailandTogoTongaTrinidad and TobagoTunisiaTurkeyTurkmenistanTuvaluUgandaUkraineUnited Arab EmiratesUnited KingdomUnited StatesUpper middle incomeUruguayUzbekistanVanuatuVenezuela, RBVietnamWorldYemen, Rep.ZambiaZimbabwe Timeline:
This timeline shows a graph from 1961 to 2015 of Argentina. No data until 1960. Number of actual observations by date: 55.
Source name:
World Development Indicators
Source organization:
World Bank staff estimates based data from International Monetary Fund's Direction of Trade database.
Categories, topics:
Private Sector, Trade
Last updated:
apr 23, 2017
Indicators value changes by year
Minimum:
39.943
jan 1, 2015
Maximum:
82.867
jan 1, 1962
At the date of observation
Value
Absolute change
Change from previous value
jan 1, 1961
81.401
+81.401
0.0%
jan 1, 1962
82.867
+1.465
1.8%
jan 1, 1963
79.356
-3.511
-4.24%
jan 1, 1964
80.731
+1.376
1.73%
jan 1, 1965
73.725
-7.007
-8.68%
jan 1, 1966
70.927
-2.798
-3.79%
jan 1, 1967
71.59
+0.663
0.93%
jan 1, 1968
77.367
+5.777
8.07%
jan 1, 1969
73.771
-3.596
-4.65%
jan 1, 1970
76.529
+2.758
3.74%
jan 1, 1971
77.635
+1.106
1.45%
jan 1, 1972
80.681
+3.046
3.92%
jan 1, 1973
78.456
-2.225
-2.76%
jan 1, 1974
70.281
-8.175
-10.42%
jan 1, 1975
63.228
-7.053
-10.04%
jan 1, 1976
55.697
-7.531
-11.91%
jan 1, 1977
63.64
+7.942
14.26%
jan 1, 1978
64.442
+0.803
1.26%
jan 1, 1979
66.243
+1.801
2.79%
jan 1, 1980
64.674
-1.569
-2.37%
jan 1, 1981
51.852
-12.822
-19.82%
jan 1, 1982
44.151
-7.701
-14.85%
jan 1, 1983
50.627
+6.476
14.67%
jan 1, 1984
45.946
-4.681
-9.25%
jan 1, 1985
48.681
+2.735
5.95%
jan 1, 1986
47.381
-1.3
-2.67%
jan 1, 1987
53.523
+6.142
12.96%
jan 1, 1988
55.815
+2.293
4.28%
jan 1, 1989
56.259
+0.443
0.79%
jan 1, 1990
52.66
-3.599
-6.4%
jan 1, 1991
57.453
+4.793
9.1%
jan 1, 1992
60.184
+2.731
4.75%
jan 1, 1993
58.302
-1.882
-3.13%
jan 1, 1994
56.142
-2.159
-3.7%
jan 1, 1995
53.72
-2.423
-4.31%
jan 1, 1996
47.609
-6.11
-11.37%
jan 1, 1997
45.945
-1.664
-3.5%
jan 1, 1998
42.41
-3.535
-7.69%
jan 1, 1999
44.064
+1.654
3.9%
jan 1, 2000
52.717
+8.653
19.64%
jan 1, 2001
50.156
-2.561
-4.86%
jan 1, 2002
49.415
-0.741
-1.48%
jan 1, 2003
53.158
+3.743
7.58%
jan 1, 2004
53.02
-0.138
-0.26%
jan 1, 2005
49.972
-3.049
-5.75%
jan 1, 2006
50.342
+0.371
0.74%
jan 1, 2007
48.441
-1.902
-3.78%
jan 1, 2008
45.141
-3.3
-6.81%
jan 1, 2009
45.266
+0.126
0.28%
jan 1, 2010
46.719
+1.453
3.21%
jan 1, 2011
42.078
-4.641
-9.93%
jan 1, 2012
42.155
+0.077
0.18%
jan 1, 2013
42.316
+0.162
0.38%
jan 1, 2014
40.024
-2.292
-5.42%
jan 1, 2015
39.943
-0.081
-0.2%
Ranking of countries by current statistics by years


Comments: