29
/
en
AIzaSyAYiBZKx7MnpbEhh9jyipgxe19OcubqV5w
April 1, 2024
236043
Senegal
SEN
true
2
1
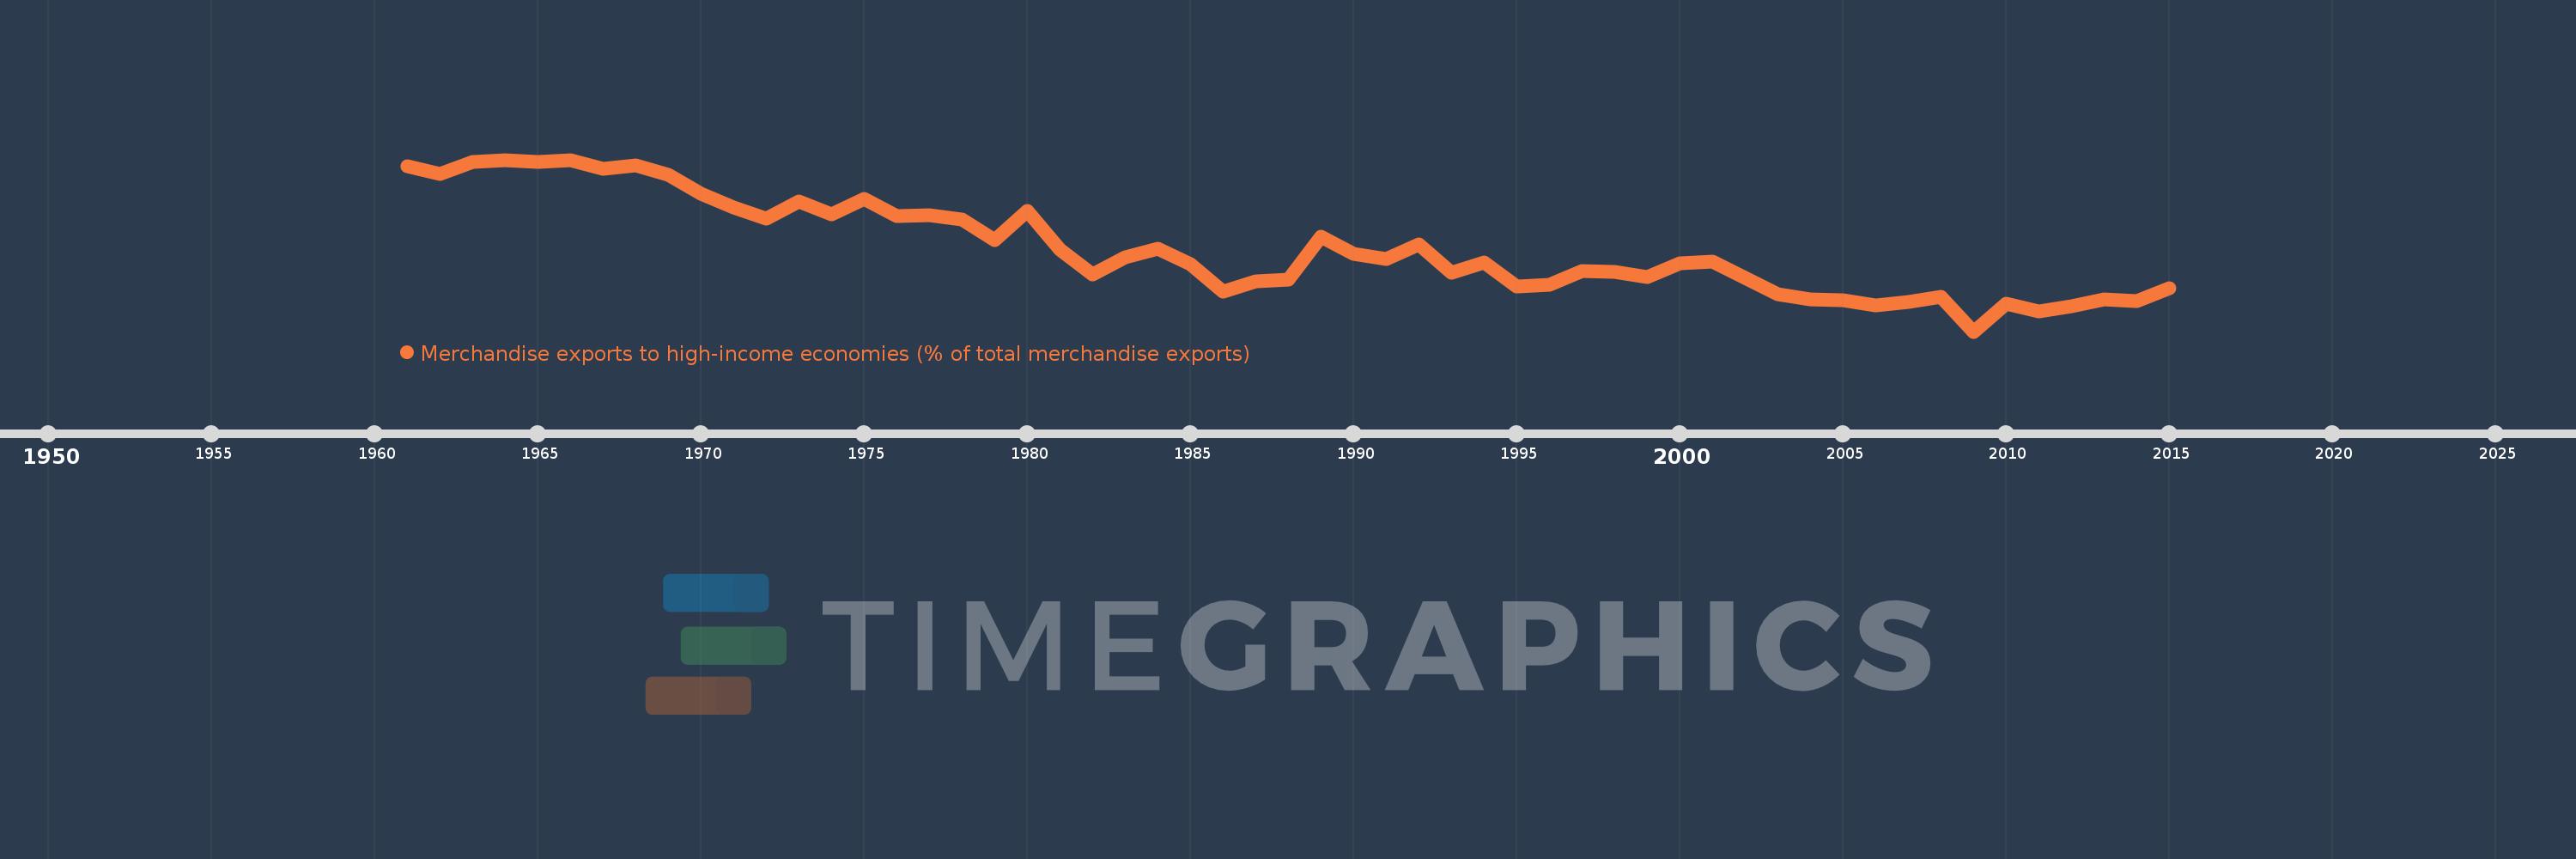
Merchandise exports to high-income economies (% of total merchandise exports)
2015,2014,2013,2012,2011,2010,2009,2008,2007,2006,2005,2004,2003,2002,2001,2000,1999,1998,1997,1996,1995,1994,1993,1992,1991,1990,1989,1988,1987,1986,1985,1984,1983,1982,1981,1980,1979,1978,1977,1976,1975,1974,1973,1972,1971,1970,1969,1968,1967,1966,1965,1964,1963,1962,1961
This statistics in other country:
AfghanistanAlbaniaAlgeriaAmerican SamoaAngolaAntigua and BarbudaArab WorldArgentinaArmeniaArubaAustraliaAustriaAzerbaijanBahamas, TheBahrainBangladeshBarbadosBelarusBelgiumBelizeBeninBermudaBoliviaBosnia and HerzegovinaBrazilBrunei DarussalamBulgariaBurkina FasoBurundiCabo VerdeCambodiaCameroonCanadaCaribbean small statesCentral African RepublicCentral Europe and the BalticsChadChileChinaColombiaComorosCongo, Dem. Rep.Congo, Rep.Costa RicaCote d'IvoireCroatiaCubaCyprusCzech RepublicDenmarkDjiboutiDominicaDominican RepublicEarly-demographic dividendEast Asia & PacificEast Asia & Pacific (excluding high income)East Asia & Pacific (IDA & IBRD countries)EcuadorEgypt, Arab Rep.El SalvadorEquatorial GuineaEstoniaEthiopiaEuro areaEurope & Central AsiaEurope & Central Asia (excluding high income)Europe & Central Asia (IDA & IBRD countries)European UnionFaroe IslandsFijiFinlandFragile and conflict affected situationsFranceFrench PolynesiaGabonGambia, TheGeorgiaGermanyGhanaGibraltarGreeceGreenlandGrenadaGuamGuatemalaGuineaGuinea-BissauGuyanaHaitiHeavily indebted poor countries (HIPC)High incomeHondurasHong Kong SAR, ChinaHungaryIBRD onlyIcelandIDA & IBRD totalIDA blendIDA onlyIDA totalIndiaIndonesiaIran, Islamic Rep.IraqIrelandIsraelItalyJamaicaJapanJordanKazakhstanKenyaKiribatiKorea, Dem. People’s Rep.Korea, Rep.KosovoKuwaitKyrgyz RepublicLao PDRLate-demographic dividendLatin America & Caribbean Latin America & Caribbean (excluding high income)Latin America & the Caribbean (IDA & IBRD countries)LatviaLeast developed countries: UN classificationLebanonLiberiaLibyaLithuaniaLow & middle incomeLow incomeLower middle incomeLuxembourgMacao SAR, ChinaMacedonia, FYRMadagascarMalawiMalaysiaMaldivesMaliMaltaMauritaniaMauritiusMexicoMiddle East & North AfricaMiddle East & North Africa (excluding high income)Middle East & North Africa (IDA & IBRD countries)Middle incomeMoldovaMongoliaMontenegroMoroccoMozambiqueMyanmarNauruNepalNetherlandsNew CaledoniaNew ZealandNicaraguaNigerNigeriaNorth AmericaNorwayOECD membersOmanOther small statesPacific island small statesPakistanPanamaPapua New GuineaParaguayPeruPhilippinesPolandPortugalPost-demographic dividendPre-demographic dividendQatarRomaniaRussian FederationRwandaSamoaSao Tome and PrincipeSaudi ArabiaSenegalSerbiaSeychellesSierra LeoneSingaporeSlovak RepublicSloveniaSmall statesSolomon IslandsSomaliaSouth AfricaSouth AsiaSouth Asia (IDA & IBRD)SpainSri LankaSt. Kitts and NevisSt. LuciaSt. Vincent and the GrenadinesSub-Saharan Africa Sub-Saharan Africa (excluding high income)Sub-Saharan Africa (IDA & IBRD countries)SudanSurinameSwedenSwitzerlandSyrian Arab RepublicTajikistanTanzaniaThailandTogoTongaTrinidad and TobagoTunisiaTurkeyTurkmenistanTuvaluUgandaUkraineUnited Arab EmiratesUnited KingdomUnited StatesUpper middle incomeUruguayUzbekistanVanuatuVenezuela, RBVietnamWorldYemen, Rep.ZambiaZimbabwe Timeline:
This timeline shows a graph from 1961 to 2015 of Senegal. No data until 1960. Number of actual observations by date: 55.
Source name:
World Development Indicators
Source organization:
World Bank staff estimates based data from International Monetary Fund's Direction of Trade database.
Categories, topics:
Private Sector, Trade
Last updated:
apr 23, 2017
Indicators value changes by year
Minimum:
18.061
jan 1, 2009
Maximum:
93.014
jan 1, 1966
At the date of observation
Value
Absolute change
Change from previous value
jan 1, 1961
90.143
+90.143
0.0%
jan 1, 1962
86.667
-3.477
-3.86%
jan 1, 1963
92.227
+5.56
6.42%
jan 1, 1964
93.013
+0.786
0.85%
jan 1, 1965
91.997
-1.016
-1.09%
jan 1, 1966
93.014
+1.017
1.11%
jan 1, 1967
89.187
-3.827
-4.11%
jan 1, 1968
90.612
+1.425
1.6%
jan 1, 1969
86.636
-3.976
-4.39%
jan 1, 1970
78.173
-8.462
-9.77%
jan 1, 1971
72.292
-5.882
-7.52%
jan 1, 1972
67.51
-4.782
-6.61%
jan 1, 1973
74.783
+7.272
10.77%
jan 1, 1974
69.087
-5.695
-7.62%
jan 1, 1975
76.046
+6.959
10.07%
jan 1, 1976
68.295
-7.751
-10.19%
jan 1, 1977
68.982
+0.687
1.01%
jan 1, 1978
66.931
-2.051
-2.97%
jan 1, 1979
58.078
-8.852
-13.23%
jan 1, 1980
70.884
+12.806
22.05%
jan 1, 1981
53.961
-16.923
-23.87%
jan 1, 1982
43.058
-10.903
-20.2%
jan 1, 1983
50.632
+7.574
17.59%
jan 1, 1984
54.384
+3.752
7.41%
jan 1, 1985
47.505
-6.879
-12.65%
jan 1, 1986
35.36
-12.144
-25.56%
jan 1, 1987
39.88
+4.52
12.78%
jan 1, 1988
40.836
+0.956
2.4%
jan 1, 1989
59.466
+18.629
45.62%
jan 1, 1990
51.928
-7.538
-12.68%
jan 1, 1991
49.643
-2.285
-4.4%
jan 1, 1992
56.243
+6.601
13.3%
jan 1, 1993
43.791
-12.452
-22.14%
jan 1, 1994
48.286
+4.494
10.26%
jan 1, 1995
37.749
-10.537
-21.82%
jan 1, 1996
38.386
+0.638
1.69%
jan 1, 1997
44.489
+6.102
15.9%
jan 1, 1998
44.245
-0.243
-0.55%
jan 1, 1999
41.681
-2.565
-5.8%
jan 1, 2000
47.846
+6.165
14.79%
jan 1, 2001
48.72
+0.874
1.83%
jan 1, 2002
41.632
-7.088
-14.55%
jan 1, 2003
34.403
-7.229
-17.36%
jan 1, 2004
32.227
-2.177
-6.33%
jan 1, 2005
31.564
-0.662
-2.06%
jan 1, 2006
29.484
-2.08
-6.59%
jan 1, 2007
30.998
+1.514
5.14%
jan 1, 2008
33.298
+2.299
7.42%
jan 1, 2009
18.061
-15.237
-45.76%
jan 1, 2010
30.059
+11.998
66.43%
jan 1, 2011
26.892
-3.167
-10.54%
jan 1, 2012
29.184
+2.292
8.52%
jan 1, 2013
31.95
+2.766
9.48%
jan 1, 2014
31.351
-0.599
-1.87%
jan 1, 2015
36.904
+5.552
17.71%
Ranking of countries by current statistics by years


Comments: