29
/
en
AIzaSyAYiBZKx7MnpbEhh9jyipgxe19OcubqV5w
April 1, 2024
231316
Rwanda
RWA
true
2
1
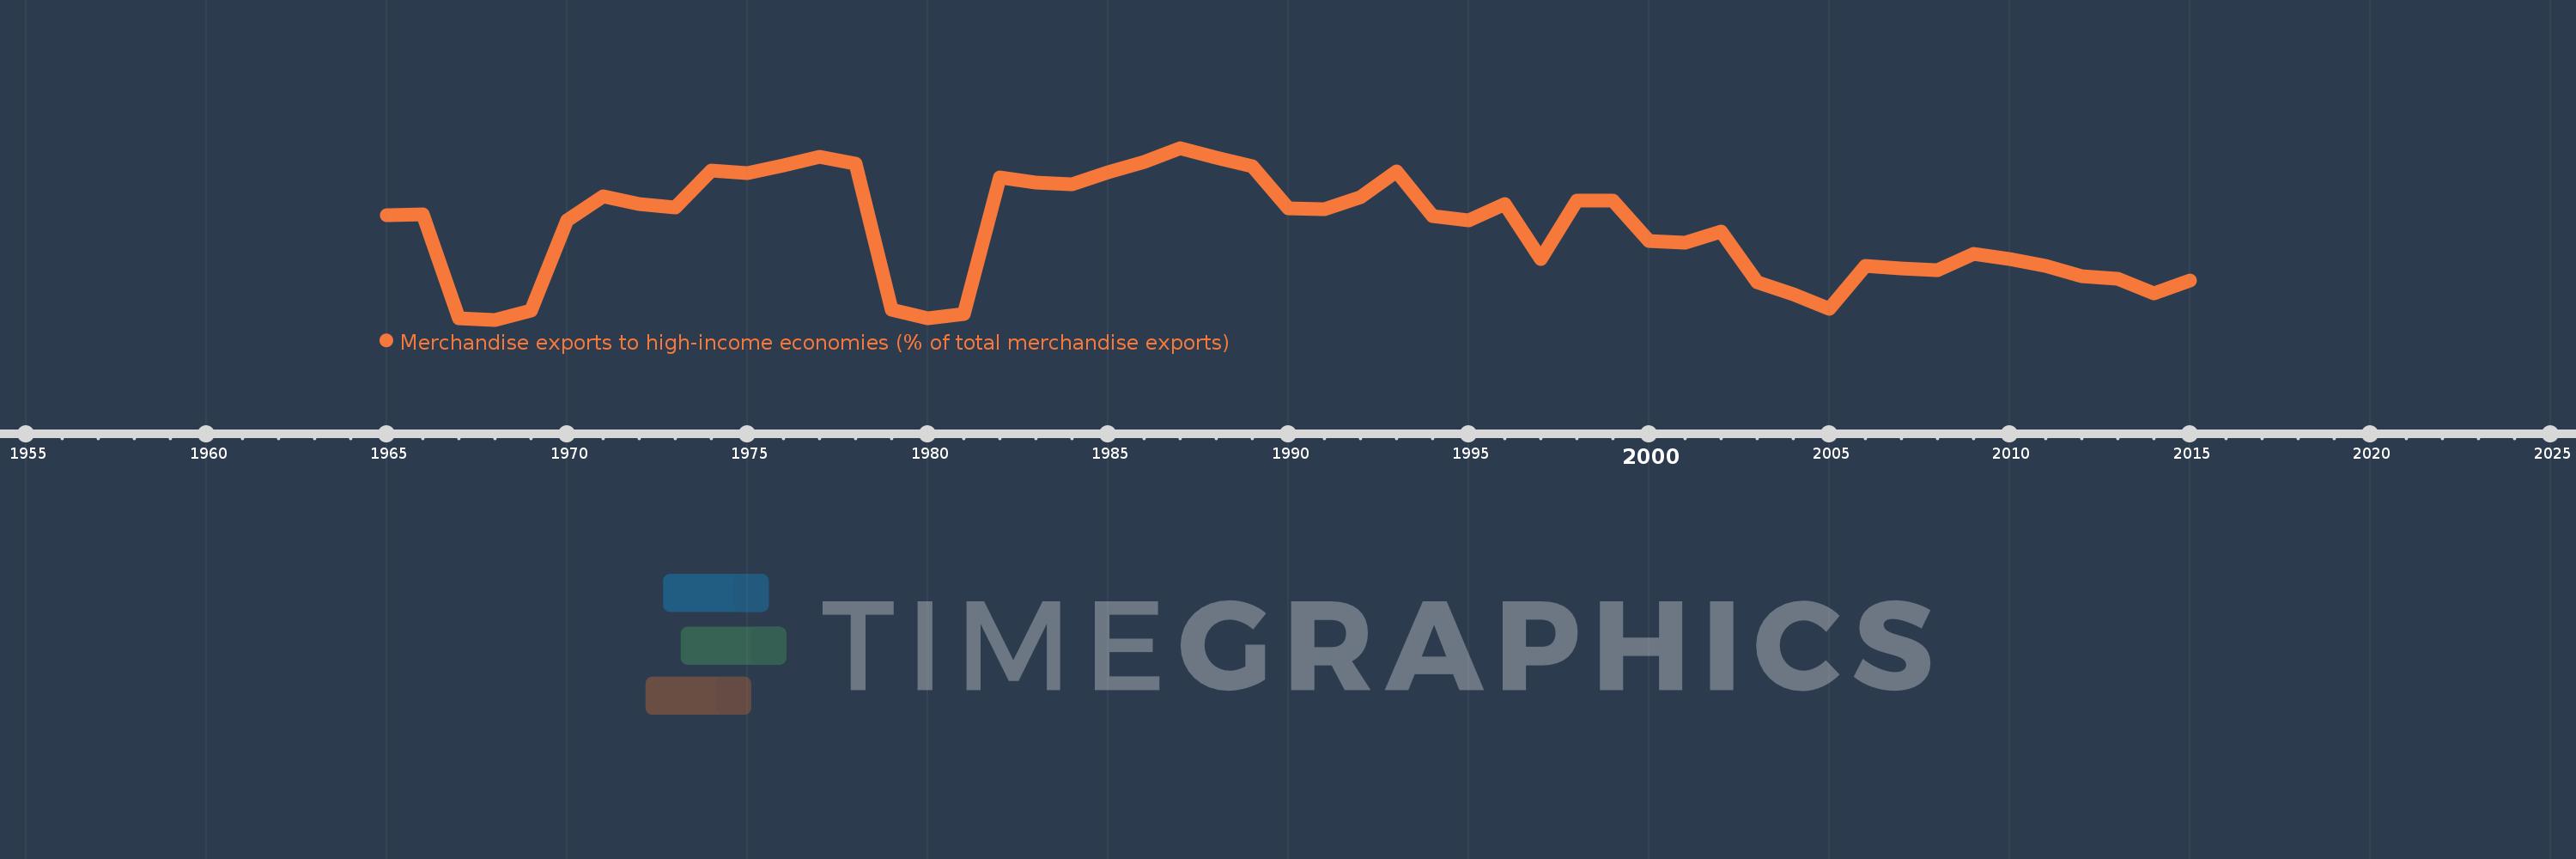
Merchandise exports to high-income economies (% of total merchandise exports)
2015,2014,2013,2012,2011,2010,2009,2008,2007,2006,2005,2004,2003,2002,2001,2000,1999,1998,1997,1996,1995,1994,1993,1992,1991,1990,1989,1988,1987,1986,1985,1984,1983,1982,1981,1980,1979,1978,1977,1976,1975,1974,1973,1972,1971,1970,1969,1968,1967,1966,1965
This statistics in other country:
AfghanistanAlbaniaAlgeriaAmerican SamoaAngolaAntigua and BarbudaArab WorldArgentinaArmeniaArubaAustraliaAustriaAzerbaijanBahamas, TheBahrainBangladeshBarbadosBelarusBelgiumBelizeBeninBermudaBoliviaBosnia and HerzegovinaBrazilBrunei DarussalamBulgariaBurkina FasoBurundiCabo VerdeCambodiaCameroonCanadaCaribbean small statesCentral African RepublicCentral Europe and the BalticsChadChileChinaColombiaComorosCongo, Dem. Rep.Congo, Rep.Costa RicaCote d'IvoireCroatiaCubaCyprusCzech RepublicDenmarkDjiboutiDominicaDominican RepublicEarly-demographic dividendEast Asia & PacificEast Asia & Pacific (excluding high income)East Asia & Pacific (IDA & IBRD countries)EcuadorEgypt, Arab Rep.El SalvadorEquatorial GuineaEstoniaEthiopiaEuro areaEurope & Central AsiaEurope & Central Asia (excluding high income)Europe & Central Asia (IDA & IBRD countries)European UnionFaroe IslandsFijiFinlandFragile and conflict affected situationsFranceFrench PolynesiaGabonGambia, TheGeorgiaGermanyGhanaGibraltarGreeceGreenlandGrenadaGuamGuatemalaGuineaGuinea-BissauGuyanaHaitiHeavily indebted poor countries (HIPC)High incomeHondurasHong Kong SAR, ChinaHungaryIBRD onlyIcelandIDA & IBRD totalIDA blendIDA onlyIDA totalIndiaIndonesiaIran, Islamic Rep.IraqIrelandIsraelItalyJamaicaJapanJordanKazakhstanKenyaKiribatiKorea, Dem. People’s Rep.Korea, Rep.KosovoKuwaitKyrgyz RepublicLao PDRLate-demographic dividendLatin America & Caribbean Latin America & Caribbean (excluding high income)Latin America & the Caribbean (IDA & IBRD countries)LatviaLeast developed countries: UN classificationLebanonLiberiaLibyaLithuaniaLow & middle incomeLow incomeLower middle incomeLuxembourgMacao SAR, ChinaMacedonia, FYRMadagascarMalawiMalaysiaMaldivesMaliMaltaMauritaniaMauritiusMexicoMiddle East & North AfricaMiddle East & North Africa (excluding high income)Middle East & North Africa (IDA & IBRD countries)Middle incomeMoldovaMongoliaMontenegroMoroccoMozambiqueMyanmarNauruNepalNetherlandsNew CaledoniaNew ZealandNicaraguaNigerNigeriaNorth AmericaNorwayOECD membersOmanOther small statesPacific island small statesPakistanPanamaPapua New GuineaParaguayPeruPhilippinesPolandPortugalPost-demographic dividendPre-demographic dividendQatarRomaniaRussian FederationRwandaSamoaSao Tome and PrincipeSaudi ArabiaSenegalSerbiaSeychellesSierra LeoneSingaporeSlovak RepublicSloveniaSmall statesSolomon IslandsSomaliaSouth AfricaSouth AsiaSouth Asia (IDA & IBRD)SpainSri LankaSt. Kitts and NevisSt. LuciaSt. Vincent and the GrenadinesSub-Saharan Africa Sub-Saharan Africa (excluding high income)Sub-Saharan Africa (IDA & IBRD countries)SudanSurinameSwedenSwitzerlandSyrian Arab RepublicTajikistanTanzaniaThailandTogoTongaTrinidad and TobagoTunisiaTurkeyTurkmenistanTuvaluUgandaUkraineUnited Arab EmiratesUnited KingdomUnited StatesUpper middle incomeUruguayUzbekistanVanuatuVenezuela, RBVietnamWorldYemen, Rep.ZambiaZimbabwe Timeline:
This timeline shows a graph from 1965 to 2015 of Rwanda. No data until 1964. Number of actual observations by date: 51.
Source name:
World Development Indicators
Source organization:
World Bank staff estimates based data from International Monetary Fund's Direction of Trade database.
Categories, topics:
Private Sector, Trade
Last updated:
apr 23, 2017
Indicators value changes by year
Maximum:
90.858
jan 1, 1987
At the date of observation
Value
Absolute change
Change from previous value
jan 1, 1965
56.897
+56.897
0.0%
jan 1, 1966
57.143
+0.246
0.43%
jan 1, 1967
4.237
-52.906
-92.58%
jan 1, 1968
3.571
-0.666
-15.71%
jan 1, 1969
8.163
+4.592
128.57%
jan 1, 1970
54.225
+46.062
564.26%
jan 1, 1971
66.397
+12.171
22.45%
jan 1, 1972
62.332
-4.065
-6.12%
jan 1, 1973
60.622
-1.71
-2.74%
jan 1, 1974
79.566
+18.945
31.25%
jan 1, 1975
78.216
-1.35
-1.7%
jan 1, 1976
82.033
+3.817
4.88%
jan 1, 1977
86.381
+4.348
5.3%
jan 1, 1978
83.013
-3.369
-3.9%
jan 1, 1979
8.566
-74.447
-89.68%
jan 1, 1980
4.274
-4.292
-50.1%
jan 1, 1981
6.278
+2.004
46.88%
jan 1, 1982
75.785
+69.507
1.11K%
jan 1, 1983
73.294
-2.49
-3.29%
jan 1, 1984
72.248
-1.046
-1.43%
jan 1, 1985
78.51
+6.262
8.67%
jan 1, 1986
83.859
+5.349
6.81%
jan 1, 1987
90.858
+6.999
8.35%
jan 1, 1988
86.031
-4.827
-5.31%
jan 1, 1989
81.556
-4.475
-5.2%
jan 1, 1990
60.247
-21.309
-26.13%
jan 1, 1991
59.582
-0.666
-1.1%
jan 1, 1992
66.058
+6.476
10.87%
jan 1, 1993
78.929
+12.871
19.48%
jan 1, 1994
56.205
-22.724
-28.79%
jan 1, 1995
54.184
-2.021
-3.6%
jan 1, 1996
62.324
+8.14
15.02%
jan 1, 1997
34.304
-28.02
-44.96%
jan 1, 1998
64.102
+29.798
86.87%
jan 1, 1999
64.02
-0.081
-0.13%
jan 1, 2000
43.412
-20.608
-32.19%
jan 1, 2001
42.641
-0.771
-1.78%
jan 1, 2002
48.588
+5.948
13.95%
jan 1, 2003
22.578
-26.01
-53.53%
jan 1, 2004
16.491
-6.087
-26.96%
jan 1, 2005
9.046
-7.445
-45.14%
jan 1, 2006
31.136
+22.09
244.19%
jan 1, 2007
29.439
-1.697
-5.45%
jan 1, 2008
28.668
-0.771
-2.62%
jan 1, 2009
37.037
+8.37
29.2%
jan 1, 2010
34.26
-2.778
-7.5%
jan 1, 2011
30.853
-3.406
-9.94%
jan 1, 2012
25.777
-5.076
-16.45%
jan 1, 2013
24.235
-1.542
-5.98%
jan 1, 2014
16.853
-7.383
-30.46%
jan 1, 2015
23.321
+6.468
38.38%
Ranking of countries by current statistics by years


Comments: