29
/
en
AIzaSyAYiBZKx7MnpbEhh9jyipgxe19OcubqV5w
April 1, 2024
83053
Belize
BLZ
true
2
1
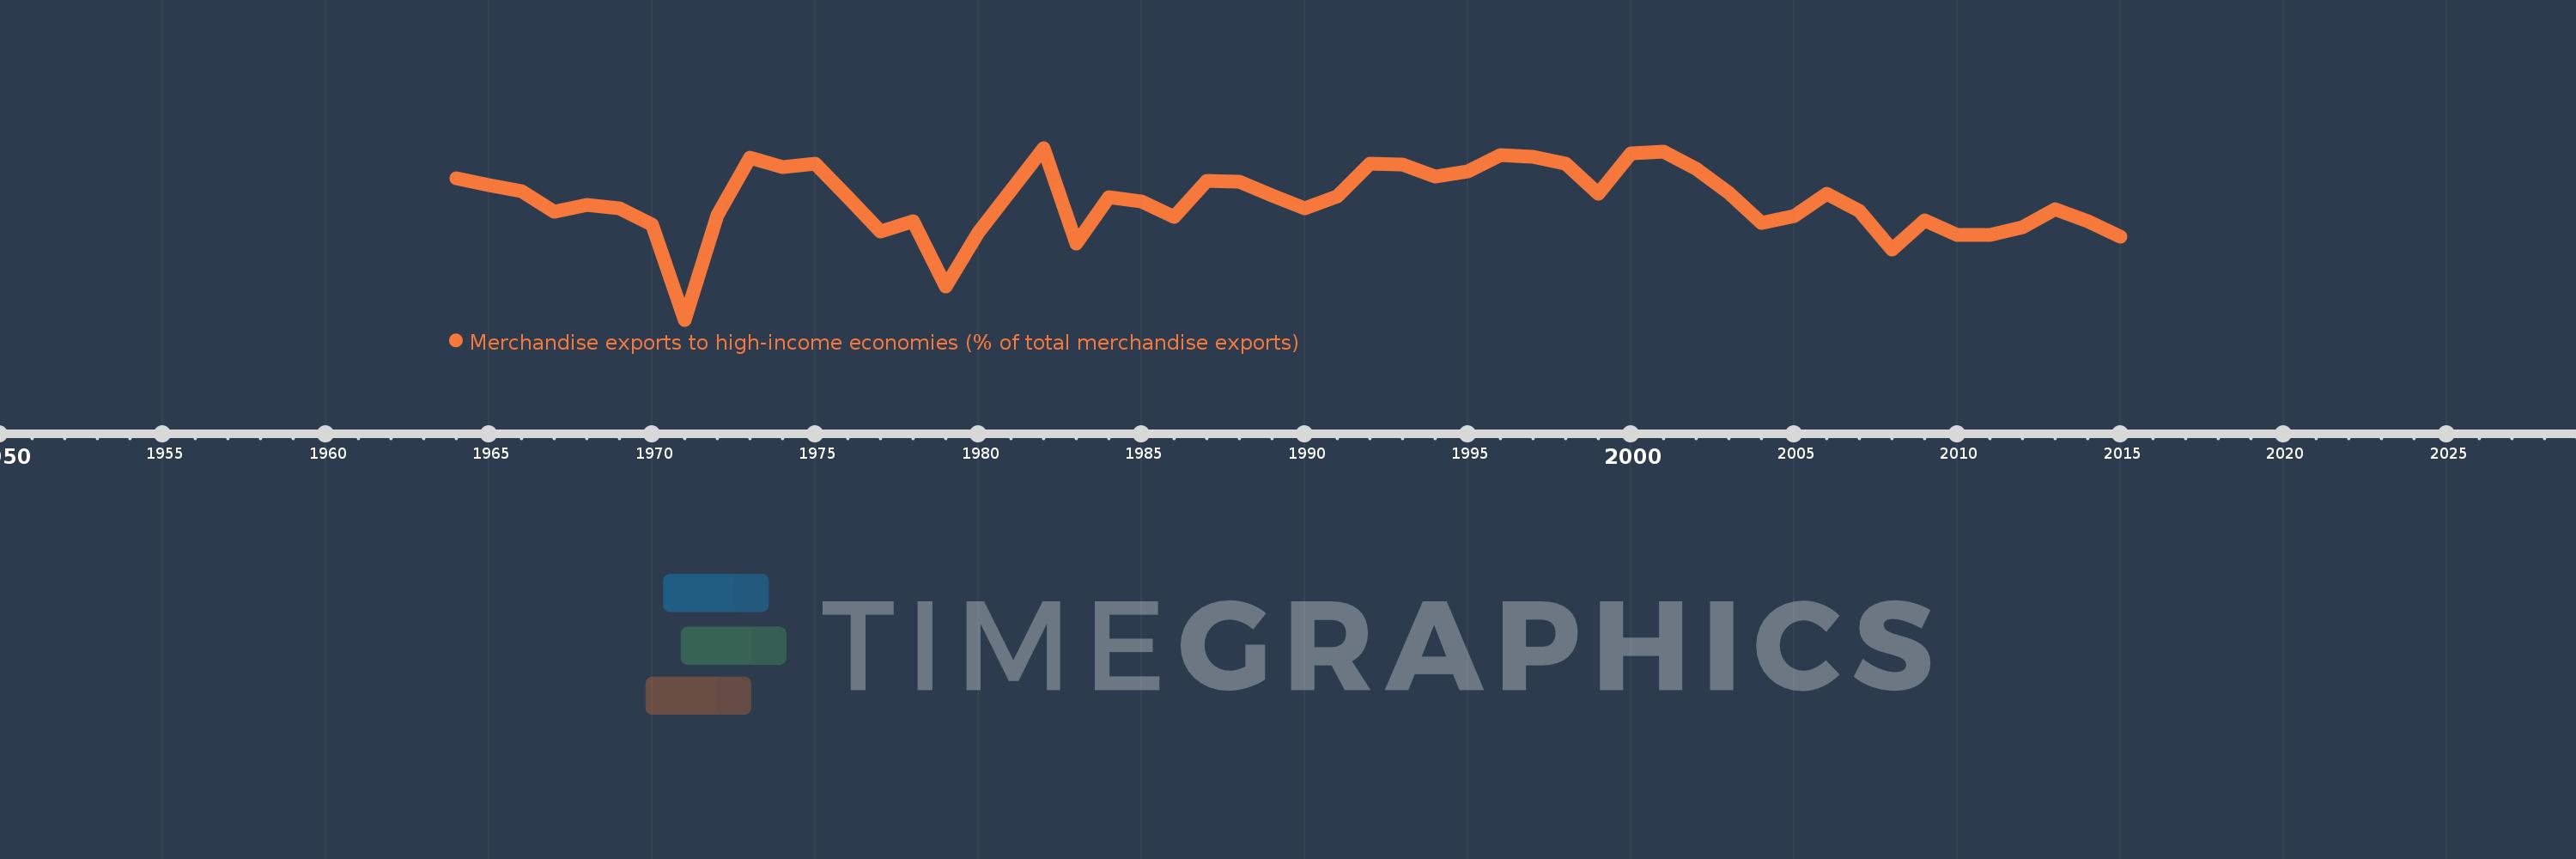
Merchandise exports to high-income economies (% of total merchandise exports)
2015,2014,2013,2012,2011,2010,2009,2008,2007,2006,2005,2004,2003,2002,2001,2000,1999,1998,1997,1996,1995,1994,1993,1992,1991,1990,1989,1988,1987,1986,1985,1984,1983,1982,1980,1979,1978,1977,1976,1975,1974,1973,1972,1971,1970,1969,1968,1967,1966,1965,1964
This statistics in other country:
AfghanistanAlbaniaAlgeriaAmerican SamoaAngolaAntigua and BarbudaArab WorldArgentinaArmeniaArubaAustraliaAustriaAzerbaijanBahamas, TheBahrainBangladeshBarbadosBelarusBelgiumBelizeBeninBermudaBoliviaBosnia and HerzegovinaBrazilBrunei DarussalamBulgariaBurkina FasoBurundiCabo VerdeCambodiaCameroonCanadaCaribbean small statesCentral African RepublicCentral Europe and the BalticsChadChileChinaColombiaComorosCongo, Dem. Rep.Congo, Rep.Costa RicaCote d'IvoireCroatiaCubaCyprusCzech RepublicDenmarkDjiboutiDominicaDominican RepublicEarly-demographic dividendEast Asia & PacificEast Asia & Pacific (excluding high income)East Asia & Pacific (IDA & IBRD countries)EcuadorEgypt, Arab Rep.El SalvadorEquatorial GuineaEstoniaEthiopiaEuro areaEurope & Central AsiaEurope & Central Asia (excluding high income)Europe & Central Asia (IDA & IBRD countries)European UnionFaroe IslandsFijiFinlandFragile and conflict affected situationsFranceFrench PolynesiaGabonGambia, TheGeorgiaGermanyGhanaGibraltarGreeceGreenlandGrenadaGuamGuatemalaGuineaGuinea-BissauGuyanaHaitiHeavily indebted poor countries (HIPC)High incomeHondurasHong Kong SAR, ChinaHungaryIBRD onlyIcelandIDA & IBRD totalIDA blendIDA onlyIDA totalIndiaIndonesiaIran, Islamic Rep.IraqIrelandIsraelItalyJamaicaJapanJordanKazakhstanKenyaKiribatiKorea, Dem. People’s Rep.Korea, Rep.KosovoKuwaitKyrgyz RepublicLao PDRLate-demographic dividendLatin America & Caribbean Latin America & Caribbean (excluding high income)Latin America & the Caribbean (IDA & IBRD countries)LatviaLeast developed countries: UN classificationLebanonLiberiaLibyaLithuaniaLow & middle incomeLow incomeLower middle incomeLuxembourgMacao SAR, ChinaMacedonia, FYRMadagascarMalawiMalaysiaMaldivesMaliMaltaMauritaniaMauritiusMexicoMiddle East & North AfricaMiddle East & North Africa (excluding high income)Middle East & North Africa (IDA & IBRD countries)Middle incomeMoldovaMongoliaMontenegroMoroccoMozambiqueMyanmarNauruNepalNetherlandsNew CaledoniaNew ZealandNicaraguaNigerNigeriaNorth AmericaNorwayOECD membersOmanOther small statesPacific island small statesPakistanPanamaPapua New GuineaParaguayPeruPhilippinesPolandPortugalPost-demographic dividendPre-demographic dividendQatarRomaniaRussian FederationRwandaSamoaSao Tome and PrincipeSaudi ArabiaSenegalSerbiaSeychellesSierra LeoneSingaporeSlovak RepublicSloveniaSmall statesSolomon IslandsSomaliaSouth AfricaSouth AsiaSouth Asia (IDA & IBRD)SpainSri LankaSt. Kitts and NevisSt. LuciaSt. Vincent and the GrenadinesSub-Saharan Africa Sub-Saharan Africa (excluding high income)Sub-Saharan Africa (IDA & IBRD countries)SudanSurinameSwedenSwitzerlandSyrian Arab RepublicTajikistanTanzaniaThailandTogoTongaTrinidad and TobagoTunisiaTurkeyTurkmenistanTuvaluUgandaUkraineUnited Arab EmiratesUnited KingdomUnited StatesUpper middle incomeUruguayUzbekistanVanuatuVenezuela, RBVietnamWorldYemen, Rep.ZambiaZimbabwe Timeline:
This timeline shows a graph from 1964 to 2015 of Belize. No data until 1963. Number of actual observations by date: 51.
Source name:
World Development Indicators
Source organization:
World Bank staff estimates based data from International Monetary Fund's Direction of Trade database.
Categories, topics:
Private Sector, Trade
Last updated:
apr 23, 2017
Indicators value changes by year
Minimum:
41.962
jan 1, 1971
Maximum:
96.912
jan 1, 1982
At the date of observation
Value
Absolute change
Change from previous value
jan 1, 1964
87.266
+87.266
0.0%
jan 1, 1965
85.139
-2.127
-2.44%
jan 1, 1966
83.007
-2.132
-2.5%
jan 1, 1967
76.42
-6.587
-7.94%
jan 1, 1968
78.692
+2.272
2.97%
jan 1, 1969
77.529
-1.164
-1.48%
jan 1, 1970
72.284
-5.244
-6.76%
jan 1, 1971
41.962
-30.322
-41.95%
jan 1, 1972
75.526
+33.564
79.99%
jan 1, 1973
93.842
+18.316
24.25%
jan 1, 1974
90.792
-3.049
-3.25%
jan 1, 1975
92.008
+1.215
1.34%
jan 1, 1976
81.25
-10.758
-11.69%
jan 1, 1977
70.278
-10.972
-13.5%
jan 1, 1978
73.487
+3.209
4.57%
jan 1, 1979
52.507
-20.98
-28.55%
jan 1, 1980
69.805
+17.299
32.95%
jan 1, 1982
96.912
+27.107
38.83%
jan 1, 1983
66.321
-30.591
-31.57%
jan 1, 1984
81.301
+14.98
22.59%
jan 1, 1985
79.818
-1.483
-1.82%
jan 1, 1986
74.849
-4.969
-6.23%
jan 1, 1987
86.263
+11.415
15.25%
jan 1, 1988
86.246
-0.017
-0.02%
jan 1, 1989
81.698
-4.548
-5.27%
jan 1, 1990
77.521
-4.177
-5.11%
jan 1, 1991
81.362
+3.841
4.96%
jan 1, 1992
91.85
+10.488
12.89%
jan 1, 1993
91.63
-0.22
-0.24%
jan 1, 1994
87.874
-3.756
-4.1%
jan 1, 1995
89.447
+1.573
1.79%
jan 1, 1996
94.737
+5.29
5.91%
jan 1, 1997
94.021
-0.717
-0.76%
jan 1, 1998
91.778
-2.243
-2.39%
jan 1, 1999
82.363
-9.415
-10.26%
jan 1, 2000
95.061
+12.698
15.42%
jan 1, 2001
95.84
+0.778
0.82%
jan 1, 2002
90.267
-5.573
-5.81%
jan 1, 2003
82.538
-7.728
-8.56%
jan 1, 2004
72.789
-9.749
-11.81%
jan 1, 2005
75.134
+2.345
3.22%
jan 1, 2006
82.28
+7.147
9.51%
jan 1, 2007
76.66
-5.62
-6.83%
jan 1, 2008
64.474
-12.186
-15.9%
jan 1, 2009
73.679
+9.205
14.28%
jan 1, 2010
69.123
-4.556
-6.18%
jan 1, 2011
69.192
+0.068
0.1%
jan 1, 2012
71.549
+2.358
3.41%
jan 1, 2013
77.229
+5.68
7.94%
jan 1, 2014
73.39
-3.839
-4.97%
jan 1, 2015
68.438
-4.952
-6.75%
Ranking of countries by current statistics by years


Comments: