29
/
en
AIzaSyAYiBZKx7MnpbEhh9jyipgxe19OcubqV5w
April 1, 2024
244744
Somalia
SOM
true
2
1
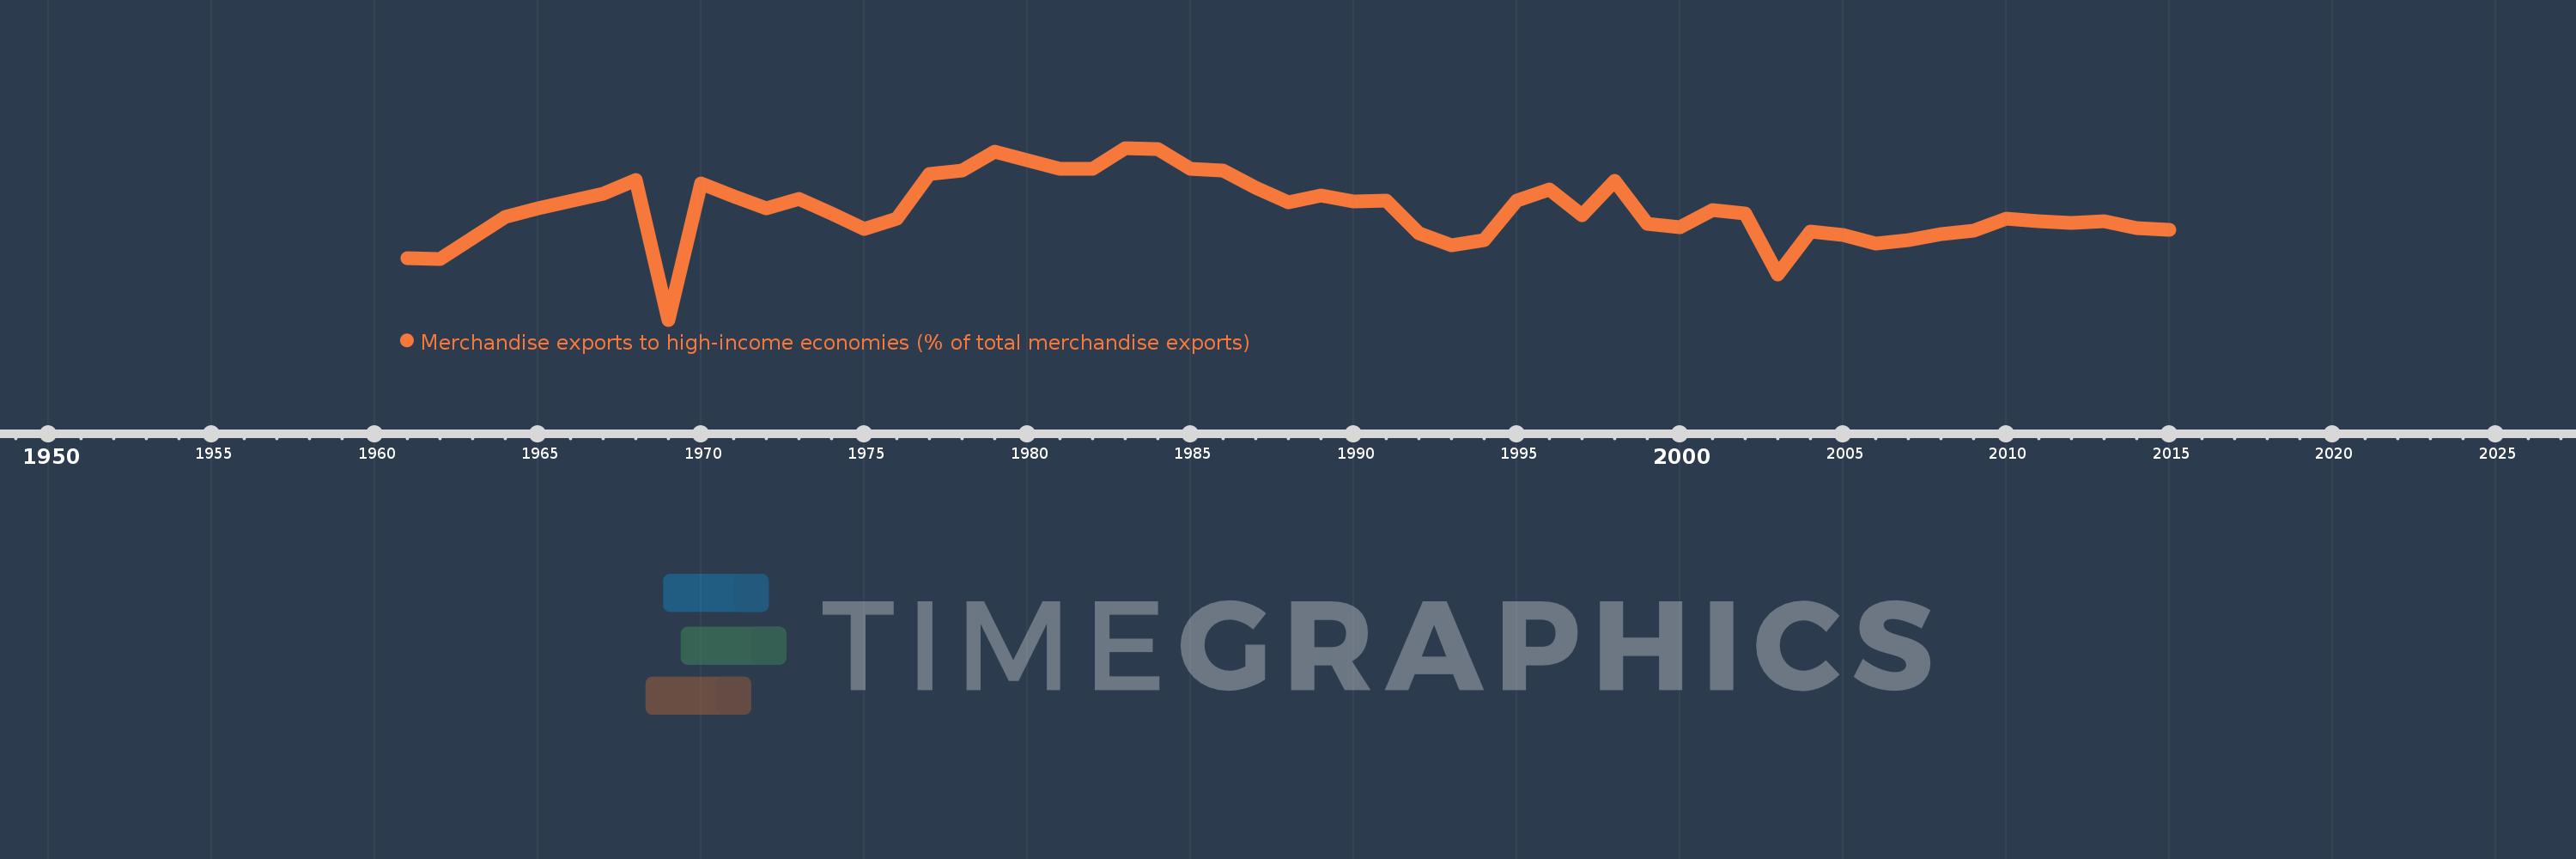
Merchandise exports to high-income economies (% of total merchandise exports)
2015,2014,2013,2012,2011,2010,2009,2008,2007,2006,2005,2004,2003,2002,2001,2000,1999,1998,1997,1996,1995,1994,1993,1992,1991,1990,1989,1988,1987,1986,1985,1984,1983,1982,1981,1979,1978,1977,1976,1975,1974,1973,1972,1971,1970,1969,1968,1967,1965,1964,1962,1961
This statistics in other country:
AfghanistanAlbaniaAlgeriaAmerican SamoaAngolaAntigua and BarbudaArab WorldArgentinaArmeniaArubaAustraliaAustriaAzerbaijanBahamas, TheBahrainBangladeshBarbadosBelarusBelgiumBelizeBeninBermudaBoliviaBosnia and HerzegovinaBrazilBrunei DarussalamBulgariaBurkina FasoBurundiCabo VerdeCambodiaCameroonCanadaCaribbean small statesCentral African RepublicCentral Europe and the BalticsChadChileChinaColombiaComorosCongo, Dem. Rep.Congo, Rep.Costa RicaCote d'IvoireCroatiaCubaCyprusCzech RepublicDenmarkDjiboutiDominicaDominican RepublicEarly-demographic dividendEast Asia & PacificEast Asia & Pacific (excluding high income)East Asia & Pacific (IDA & IBRD countries)EcuadorEgypt, Arab Rep.El SalvadorEquatorial GuineaEstoniaEthiopiaEuro areaEurope & Central AsiaEurope & Central Asia (excluding high income)Europe & Central Asia (IDA & IBRD countries)European UnionFaroe IslandsFijiFinlandFragile and conflict affected situationsFranceFrench PolynesiaGabonGambia, TheGeorgiaGermanyGhanaGibraltarGreeceGreenlandGrenadaGuamGuatemalaGuineaGuinea-BissauGuyanaHaitiHeavily indebted poor countries (HIPC)High incomeHondurasHong Kong SAR, ChinaHungaryIBRD onlyIcelandIDA & IBRD totalIDA blendIDA onlyIDA totalIndiaIndonesiaIran, Islamic Rep.IraqIrelandIsraelItalyJamaicaJapanJordanKazakhstanKenyaKiribatiKorea, Dem. People’s Rep.Korea, Rep.KosovoKuwaitKyrgyz RepublicLao PDRLate-demographic dividendLatin America & Caribbean Latin America & Caribbean (excluding high income)Latin America & the Caribbean (IDA & IBRD countries)LatviaLeast developed countries: UN classificationLebanonLiberiaLibyaLithuaniaLow & middle incomeLow incomeLower middle incomeLuxembourgMacao SAR, ChinaMacedonia, FYRMadagascarMalawiMalaysiaMaldivesMaliMaltaMauritaniaMauritiusMexicoMiddle East & North AfricaMiddle East & North Africa (excluding high income)Middle East & North Africa (IDA & IBRD countries)Middle incomeMoldovaMongoliaMontenegroMoroccoMozambiqueMyanmarNauruNepalNetherlandsNew CaledoniaNew ZealandNicaraguaNigerNigeriaNorth AmericaNorwayOECD membersOmanOther small statesPacific island small statesPakistanPanamaPapua New GuineaParaguayPeruPhilippinesPolandPortugalPost-demographic dividendPre-demographic dividendQatarRomaniaRussian FederationRwandaSamoaSao Tome and PrincipeSaudi ArabiaSenegalSerbiaSeychellesSierra LeoneSingaporeSlovak RepublicSloveniaSmall statesSolomon IslandsSomaliaSouth AfricaSouth AsiaSouth Asia (IDA & IBRD)SpainSri LankaSt. Kitts and NevisSt. LuciaSt. Vincent and the GrenadinesSub-Saharan Africa Sub-Saharan Africa (excluding high income)Sub-Saharan Africa (IDA & IBRD countries)SudanSurinameSwedenSwitzerlandSyrian Arab RepublicTajikistanTanzaniaThailandTogoTongaTrinidad and TobagoTunisiaTurkeyTurkmenistanTuvaluUgandaUkraineUnited Arab EmiratesUnited KingdomUnited StatesUpper middle incomeUruguayUzbekistanVanuatuVenezuela, RBVietnamWorldYemen, Rep.ZambiaZimbabwe Timeline:
This timeline shows a graph from 1961 to 2015 of Somalia. No data until 1960. Number of actual observations by date: 52.
Source name:
World Development Indicators
Source organization:
World Bank staff estimates based data from International Monetary Fund's Direction of Trade database.
Categories, topics:
Private Sector, Trade
Last updated:
apr 23, 2017
Indicators value changes by year
Minimum:
31.968
jan 1, 1969
Maximum:
99.423
jan 1, 1983
At the date of observation
Value
Absolute change
Change from previous value
jan 1, 1961
56.087
+56.087
0.0%
jan 1, 1962
55.894
-0.193
-0.34%
jan 1, 1964
72.188
+16.294
29.15%
jan 1, 1965
75.766
+3.579
4.96%
jan 1, 1967
81.459
+5.693
7.51%
jan 1, 1968
86.911
+5.452
6.69%
jan 1, 1969
31.968
-54.943
-63.22%
jan 1, 1970
85.5
+53.532
167.46%
jan 1, 1971
80.402
-5.098
-5.96%
jan 1, 1972
75.685
-4.717
-5.87%
jan 1, 1973
79.344
+3.659
4.83%
jan 1, 1974
73.784
-5.56
-7.01%
jan 1, 1975
67.494
-6.29
-8.53%
jan 1, 1976
71.788
+4.293
6.36%
jan 1, 1977
89.053
+17.265
24.05%
jan 1, 1978
90.603
+1.55
1.74%
jan 1, 1979
97.987
+7.384
8.15%
jan 1, 1981
91.356
-6.631
-6.77%
jan 1, 1982
91.356
+0.0
0.0%
jan 1, 1983
99.423
+8.067
8.83%
jan 1, 1984
98.874
-0.549
-0.55%
jan 1, 1985
91.187
-7.687
-7.77%
jan 1, 1986
90.695
-0.492
-0.54%
jan 1, 1987
83.74
-6.955
-7.67%
jan 1, 1988
77.912
-5.827
-6.96%
jan 1, 1989
80.786
+2.873
3.69%
jan 1, 1990
78.35
-2.435
-3.01%
jan 1, 1991
78.887
+0.536
0.68%
jan 1, 1992
65.903
-12.983
-16.46%
jan 1, 1993
61.154
-4.749
-7.21%
jan 1, 1994
63.205
+2.051
3.35%
jan 1, 1995
78.719
+15.514
24.55%
jan 1, 1996
83.292
+4.573
5.81%
jan 1, 1997
73.019
-10.273
-12.33%
jan 1, 1998
86.61
+13.591
18.61%
jan 1, 1999
69.591
-17.019
-19.65%
jan 1, 2000
68.363
-1.228
-1.76%
jan 1, 2001
74.902
+6.539
9.56%
jan 1, 2002
73.756
-1.146
-1.53%
jan 1, 2003
49.881
-23.875
-32.37%
jan 1, 2004
66.693
+16.812
33.7%
jan 1, 2005
65.288
-1.405
-2.11%
jan 1, 2006
61.952
-3.337
-5.11%
jan 1, 2007
63.089
+1.138
1.84%
jan 1, 2008
65.654
+2.565
4.07%
jan 1, 2009
67.082
+1.427
2.17%
jan 1, 2010
71.528
+4.446
6.63%
jan 1, 2011
70.604
-0.924
-1.29%
jan 1, 2012
70.103
-0.501
-0.71%
jan 1, 2013
70.719
+0.615
0.88%
jan 1, 2014
67.79
-2.929
-4.14%
jan 1, 2015
67.315
-0.475
-0.7%
Ranking of countries by current statistics by years


Comments: