29
/
en
AIzaSyAYiBZKx7MnpbEhh9jyipgxe19OcubqV5w
April 1, 2024
79686
Barbados
BRB
true
2
1
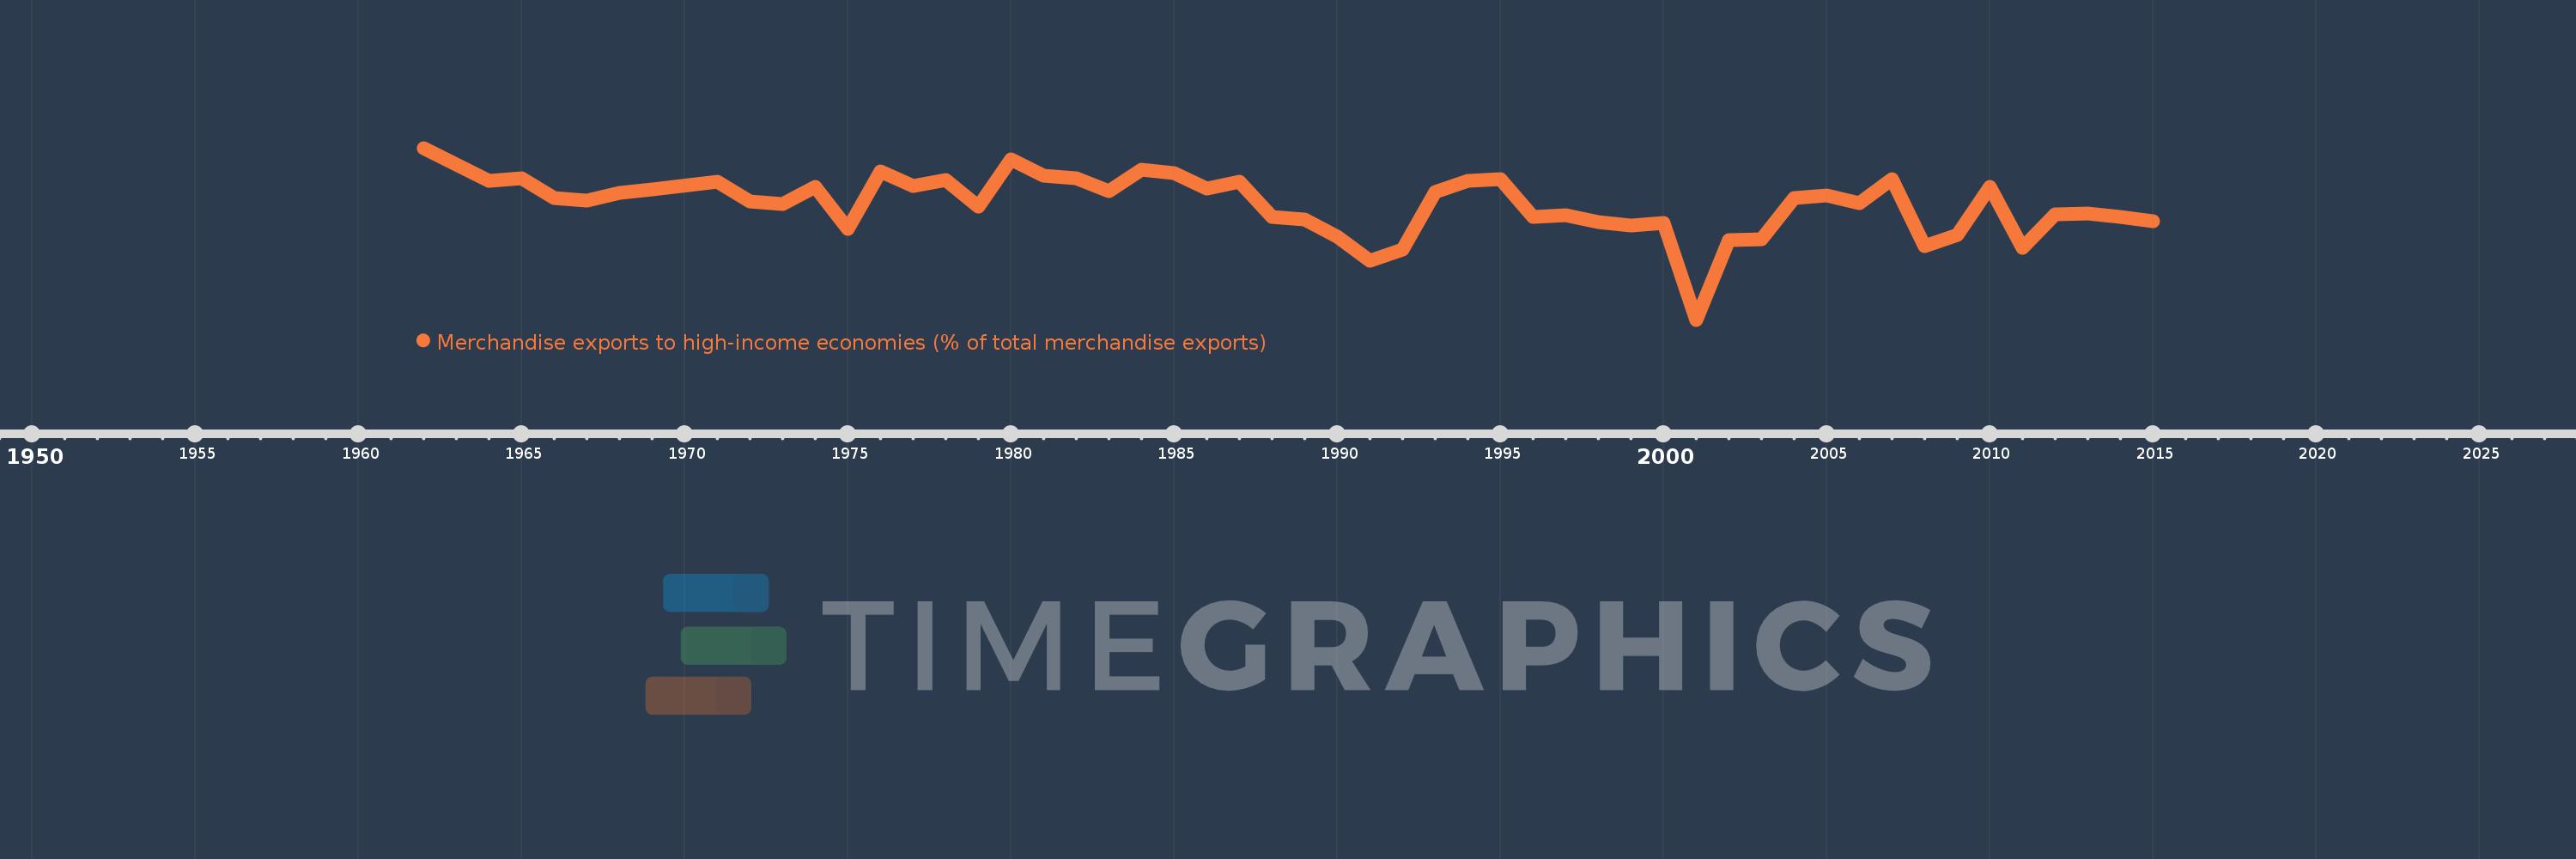
Merchandise exports to high-income economies (% of total merchandise exports)
2015,2014,2013,2012,2011,2010,2009,2008,2007,2006,2005,2004,2003,2002,2001,2000,1999,1998,1997,1996,1995,1994,1993,1992,1991,1990,1989,1988,1987,1986,1985,1984,1983,1982,1981,1980,1979,1978,1977,1976,1975,1974,1973,1972,1971,1969,1968,1967,1966,1965,1964,1963,1962
This statistics in other country:
AfghanistanAlbaniaAlgeriaAmerican SamoaAngolaAntigua and BarbudaArab WorldArgentinaArmeniaArubaAustraliaAustriaAzerbaijanBahamas, TheBahrainBangladeshBarbadosBelarusBelgiumBelizeBeninBermudaBoliviaBosnia and HerzegovinaBrazilBrunei DarussalamBulgariaBurkina FasoBurundiCabo VerdeCambodiaCameroonCanadaCaribbean small statesCentral African RepublicCentral Europe and the BalticsChadChileChinaColombiaComorosCongo, Dem. Rep.Congo, Rep.Costa RicaCote d'IvoireCroatiaCubaCyprusCzech RepublicDenmarkDjiboutiDominicaDominican RepublicEarly-demographic dividendEast Asia & PacificEast Asia & Pacific (excluding high income)East Asia & Pacific (IDA & IBRD countries)EcuadorEgypt, Arab Rep.El SalvadorEquatorial GuineaEstoniaEthiopiaEuro areaEurope & Central AsiaEurope & Central Asia (excluding high income)Europe & Central Asia (IDA & IBRD countries)European UnionFaroe IslandsFijiFinlandFragile and conflict affected situationsFranceFrench PolynesiaGabonGambia, TheGeorgiaGermanyGhanaGibraltarGreeceGreenlandGrenadaGuamGuatemalaGuineaGuinea-BissauGuyanaHaitiHeavily indebted poor countries (HIPC)High incomeHondurasHong Kong SAR, ChinaHungaryIBRD onlyIcelandIDA & IBRD totalIDA blendIDA onlyIDA totalIndiaIndonesiaIran, Islamic Rep.IraqIrelandIsraelItalyJamaicaJapanJordanKazakhstanKenyaKiribatiKorea, Dem. People’s Rep.Korea, Rep.KosovoKuwaitKyrgyz RepublicLao PDRLate-demographic dividendLatin America & Caribbean Latin America & Caribbean (excluding high income)Latin America & the Caribbean (IDA & IBRD countries)LatviaLeast developed countries: UN classificationLebanonLiberiaLibyaLithuaniaLow & middle incomeLow incomeLower middle incomeLuxembourgMacao SAR, ChinaMacedonia, FYRMadagascarMalawiMalaysiaMaldivesMaliMaltaMauritaniaMauritiusMexicoMiddle East & North AfricaMiddle East & North Africa (excluding high income)Middle East & North Africa (IDA & IBRD countries)Middle incomeMoldovaMongoliaMontenegroMoroccoMozambiqueMyanmarNauruNepalNetherlandsNew CaledoniaNew ZealandNicaraguaNigerNigeriaNorth AmericaNorwayOECD membersOmanOther small statesPacific island small statesPakistanPanamaPapua New GuineaParaguayPeruPhilippinesPolandPortugalPost-demographic dividendPre-demographic dividendQatarRomaniaRussian FederationRwandaSamoaSao Tome and PrincipeSaudi ArabiaSenegalSerbiaSeychellesSierra LeoneSingaporeSlovak RepublicSloveniaSmall statesSolomon IslandsSomaliaSouth AfricaSouth AsiaSouth Asia (IDA & IBRD)SpainSri LankaSt. Kitts and NevisSt. LuciaSt. Vincent and the GrenadinesSub-Saharan Africa Sub-Saharan Africa (excluding high income)Sub-Saharan Africa (IDA & IBRD countries)SudanSurinameSwedenSwitzerlandSyrian Arab RepublicTajikistanTanzaniaThailandTogoTongaTrinidad and TobagoTunisiaTurkeyTurkmenistanTuvaluUgandaUkraineUnited Arab EmiratesUnited KingdomUnited StatesUpper middle incomeUruguayUzbekistanVanuatuVenezuela, RBVietnamWorldYemen, Rep.ZambiaZimbabwe Timeline:
This timeline shows a graph from 1962 to 2015 of Barbados. No data until 1961. Number of actual observations by date: 53.
Source name:
World Development Indicators
Source organization:
World Bank staff estimates based data from International Monetary Fund's Direction of Trade database.
Categories, topics:
Private Sector, Trade
Last updated:
apr 23, 2017
Indicators value changes by year
Minimum:
29.454
jan 1, 2001
At the date of observation
Value
Absolute change
Change from previous value
jan 1, 1962
79.2
+79.2
0.0%
jan 1, 1963
74.33
-4.87
-6.15%
jan 1, 1964
69.608
-4.722
-6.35%
jan 1, 1965
70.455
+0.847
1.22%
jan 1, 1966
64.8
-5.655
-8.03%
jan 1, 1967
63.869
-0.931
-1.44%
jan 1, 1968
66.218
+2.349
3.68%
jan 1, 1969
67.213
+0.995
1.5%
jan 1, 1971
69.494
+2.28
3.39%
jan 1, 1972
63.742
-5.752
-8.28%
jan 1, 1973
62.957
-0.785
-1.23%
jan 1, 1974
67.963
+5.006
7.95%
jan 1, 1975
55.795
-12.168
-17.9%
jan 1, 1976
72.47
+16.676
29.89%
jan 1, 1977
68.208
-4.262
-5.88%
jan 1, 1978
69.986
+1.778
2.61%
jan 1, 1979
62.112
-7.874
-11.25%
jan 1, 1980
75.905
+13.793
22.21%
jan 1, 1981
71.275
-4.63
-6.1%
jan 1, 1982
70.45
-0.825
-1.16%
jan 1, 1983
66.806
-3.645
-5.17%
jan 1, 1984
72.945
+6.139
9.19%
jan 1, 1985
71.994
-0.951
-1.3%
jan 1, 1986
67.461
-4.532
-6.3%
jan 1, 1987
69.512
+2.051
3.04%
jan 1, 1988
59.154
-10.359
-14.9%
jan 1, 1989
58.603
-0.55
-0.93%
jan 1, 1990
53.513
-5.091
-8.69%
jan 1, 1991
46.602
-6.911
-12.91%
jan 1, 1992
49.702
+3.1
6.65%
jan 1, 1993
66.387
+16.685
33.57%
jan 1, 1994
69.655
+3.268
4.92%
jan 1, 1995
70.084
+0.429
0.62%
jan 1, 1996
59.126
-10.958
-15.64%
jan 1, 1997
59.708
+0.582
0.98%
jan 1, 1998
57.852
-1.855
-3.11%
jan 1, 1999
56.757
-1.095
-1.89%
jan 1, 2000
57.492
+0.735
1.29%
jan 1, 2001
29.454
-28.038
-48.77%
jan 1, 2002
52.615
+23.162
78.64%
jan 1, 2003
52.864
+0.248
0.47%
jan 1, 2004
64.684
+11.82
22.36%
jan 1, 2005
65.424
+0.74
1.14%
jan 1, 2006
63.288
-2.136
-3.26%
jan 1, 2007
70.118
+6.83
10.79%
jan 1, 2008
50.675
-19.443
-27.73%
jan 1, 2009
54.097
+3.421
6.75%
jan 1, 2010
68.053
+13.956
25.8%
jan 1, 2011
50.289
-17.764
-26.1%
jan 1, 2012
59.957
+9.668
19.23%
jan 1, 2013
60.279
+0.322
0.54%
jan 1, 2014
59.171
-1.109
-1.84%
jan 1, 2015
58.037
-1.133
-1.92%
Ranking of countries by current statistics by years


Comments: