29
/
en
AIzaSyAYiBZKx7MnpbEhh9jyipgxe19OcubqV5w
April 1, 2024
87514
Bolivia
BOL
true
2
1
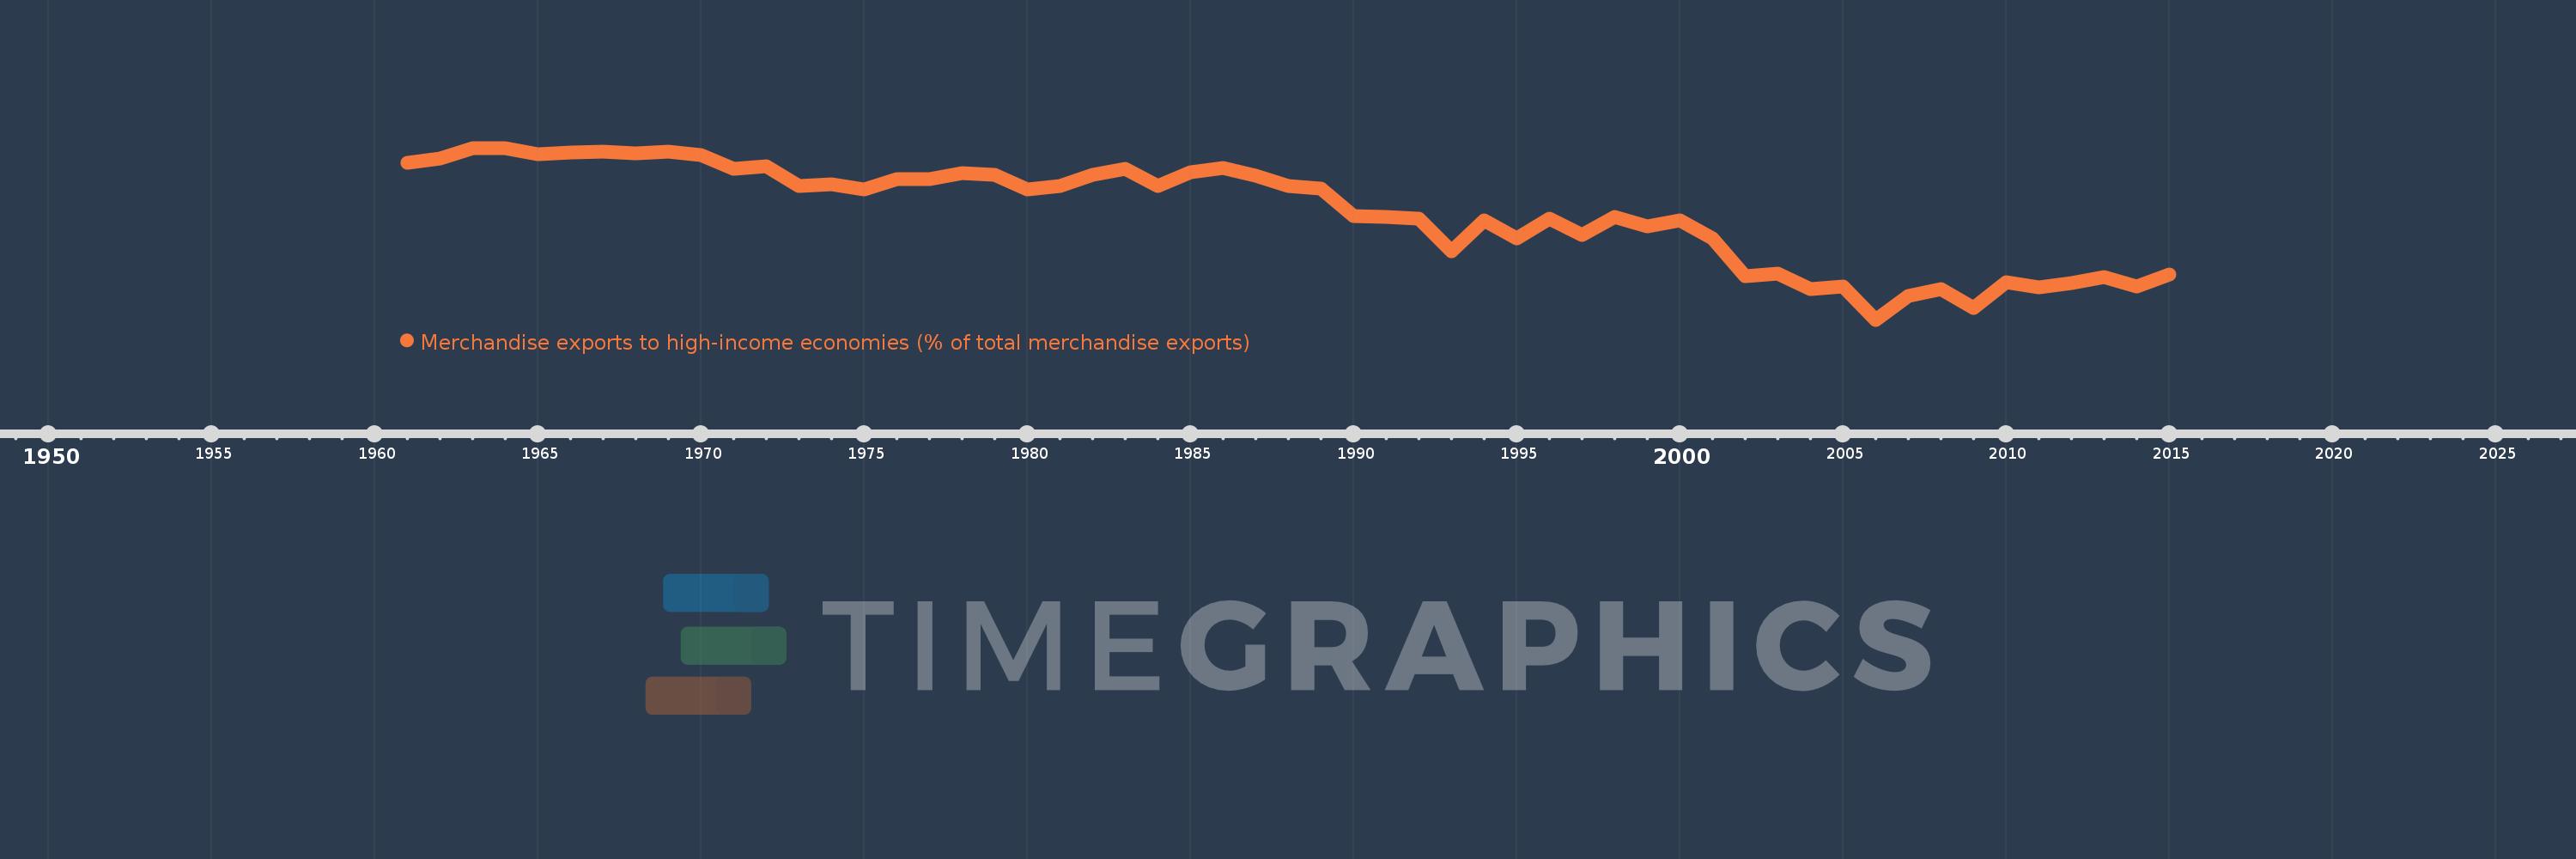
Merchandise exports to high-income economies (% of total merchandise exports)
2015,2014,2013,2012,2011,2010,2009,2008,2007,2006,2005,2004,2003,2002,2001,2000,1999,1998,1997,1996,1995,1994,1993,1992,1991,1990,1989,1988,1987,1986,1985,1984,1983,1982,1981,1980,1979,1978,1977,1976,1975,1974,1973,1972,1971,1970,1969,1968,1967,1966,1965,1964,1963,1962,1961
This statistics in other country:
AfghanistanAlbaniaAlgeriaAmerican SamoaAngolaAntigua and BarbudaArab WorldArgentinaArmeniaArubaAustraliaAustriaAzerbaijanBahamas, TheBahrainBangladeshBarbadosBelarusBelgiumBelizeBeninBermudaBoliviaBosnia and HerzegovinaBrazilBrunei DarussalamBulgariaBurkina FasoBurundiCabo VerdeCambodiaCameroonCanadaCaribbean small statesCentral African RepublicCentral Europe and the BalticsChadChileChinaColombiaComorosCongo, Dem. Rep.Congo, Rep.Costa RicaCote d'IvoireCroatiaCubaCyprusCzech RepublicDenmarkDjiboutiDominicaDominican RepublicEarly-demographic dividendEast Asia & PacificEast Asia & Pacific (excluding high income)East Asia & Pacific (IDA & IBRD countries)EcuadorEgypt, Arab Rep.El SalvadorEquatorial GuineaEstoniaEthiopiaEuro areaEurope & Central AsiaEurope & Central Asia (excluding high income)Europe & Central Asia (IDA & IBRD countries)European UnionFaroe IslandsFijiFinlandFragile and conflict affected situationsFranceFrench PolynesiaGabonGambia, TheGeorgiaGermanyGhanaGibraltarGreeceGreenlandGrenadaGuamGuatemalaGuineaGuinea-BissauGuyanaHaitiHeavily indebted poor countries (HIPC)High incomeHondurasHong Kong SAR, ChinaHungaryIBRD onlyIcelandIDA & IBRD totalIDA blendIDA onlyIDA totalIndiaIndonesiaIran, Islamic Rep.IraqIrelandIsraelItalyJamaicaJapanJordanKazakhstanKenyaKiribatiKorea, Dem. People’s Rep.Korea, Rep.KosovoKuwaitKyrgyz RepublicLao PDRLate-demographic dividendLatin America & Caribbean Latin America & Caribbean (excluding high income)Latin America & the Caribbean (IDA & IBRD countries)LatviaLeast developed countries: UN classificationLebanonLiberiaLibyaLithuaniaLow & middle incomeLow incomeLower middle incomeLuxembourgMacao SAR, ChinaMacedonia, FYRMadagascarMalawiMalaysiaMaldivesMaliMaltaMauritaniaMauritiusMexicoMiddle East & North AfricaMiddle East & North Africa (excluding high income)Middle East & North Africa (IDA & IBRD countries)Middle incomeMoldovaMongoliaMontenegroMoroccoMozambiqueMyanmarNauruNepalNetherlandsNew CaledoniaNew ZealandNicaraguaNigerNigeriaNorth AmericaNorwayOECD membersOmanOther small statesPacific island small statesPakistanPanamaPapua New GuineaParaguayPeruPhilippinesPolandPortugalPost-demographic dividendPre-demographic dividendQatarRomaniaRussian FederationRwandaSamoaSao Tome and PrincipeSaudi ArabiaSenegalSerbiaSeychellesSierra LeoneSingaporeSlovak RepublicSloveniaSmall statesSolomon IslandsSomaliaSouth AfricaSouth AsiaSouth Asia (IDA & IBRD)SpainSri LankaSt. Kitts and NevisSt. LuciaSt. Vincent and the GrenadinesSub-Saharan Africa Sub-Saharan Africa (excluding high income)Sub-Saharan Africa (IDA & IBRD countries)SudanSurinameSwedenSwitzerlandSyrian Arab RepublicTajikistanTanzaniaThailandTogoTongaTrinidad and TobagoTunisiaTurkeyTurkmenistanTuvaluUgandaUkraineUnited Arab EmiratesUnited KingdomUnited StatesUpper middle incomeUruguayUzbekistanVanuatuVenezuela, RBVietnamWorldYemen, Rep.ZambiaZimbabwe Timeline:
This timeline shows a graph from 1961 to 2015 of Bolivia. No data until 1960. Number of actual observations by date: 55.
Source name:
World Development Indicators
Source organization:
World Bank staff estimates based data from International Monetary Fund's Direction of Trade database.
Categories, topics:
Private Sector, Trade
Last updated:
apr 23, 2017
Indicators value changes by year
Maximum:
98.816
jan 1, 1963
At the date of observation
Value
Absolute change
Change from previous value
jan 1, 1961
93.814
+93.814
0.0%
jan 1, 1962
95.144
+1.33
1.42%
jan 1, 1963
98.816
+3.671
3.86%
jan 1, 1964
98.61
-0.206
-0.21%
jan 1, 1965
96.752
-1.858
-1.88%
jan 1, 1966
97.195
+0.443
0.46%
jan 1, 1967
97.407
+0.212
0.22%
jan 1, 1968
97.074
-0.333
-0.34%
jan 1, 1969
97.416
+0.341
0.35%
jan 1, 1970
96.451
-0.965
-0.99%
jan 1, 1971
91.734
-4.717
-4.89%
jan 1, 1972
92.488
+0.755
0.82%
jan 1, 1973
85.814
-6.674
-7.22%
jan 1, 1974
86.455
+0.641
0.75%
jan 1, 1975
84.404
-2.051
-2.37%
jan 1, 1976
88.068
+3.664
4.34%
jan 1, 1977
88.018
-0.051
-0.06%
jan 1, 1978
90.012
+1.994
2.27%
jan 1, 1979
89.691
-0.321
-0.36%
jan 1, 1980
84.627
-5.064
-5.65%
jan 1, 1981
85.671
+1.044
1.23%
jan 1, 1982
89.584
+3.913
4.57%
jan 1, 1983
91.576
+1.992
2.22%
jan 1, 1984
85.656
-5.92
-6.46%
jan 1, 1985
90.584
+4.928
5.75%
jan 1, 1986
91.831
+1.247
1.38%
jan 1, 1987
89.188
-2.643
-2.88%
jan 1, 1988
85.83
-3.358
-3.76%
jan 1, 1989
84.834
-0.996
-1.16%
jan 1, 1990
75.283
-9.551
-11.26%
jan 1, 1991
75.12
-0.163
-0.22%
jan 1, 1992
74.375
-0.745
-0.99%
jan 1, 1993
63.365
-11.011
-14.8%
jan 1, 1994
73.917
+10.553
16.65%
jan 1, 1995
67.838
-6.079
-8.22%
jan 1, 1996
74.453
+6.615
9.75%
jan 1, 1997
69.012
-5.441
-7.31%
jan 1, 1998
75.048
+6.036
8.75%
jan 1, 1999
71.956
-3.092
-4.12%
jan 1, 2000
73.934
+1.977
2.75%
jan 1, 2001
67.813
-6.12
-8.28%
jan 1, 2002
54.563
-13.25
-19.54%
jan 1, 2003
55.561
+0.998
1.83%
jan 1, 2004
50.384
-5.177
-9.32%
jan 1, 2005
51.128
+0.744
1.48%
jan 1, 2006
39.72
-11.408
-22.31%
jan 1, 2007
47.827
+8.107
20.41%
jan 1, 2008
50.382
+2.556
5.34%
jan 1, 2009
43.854
-6.528
-12.96%
jan 1, 2010
52.776
+8.922
20.34%
jan 1, 2011
50.907
-1.869
-3.54%
jan 1, 2012
52.362
+1.455
2.86%
jan 1, 2013
54.481
+2.118
4.05%
jan 1, 2014
51.086
-3.395
-6.23%
jan 1, 2015
55.229
+4.143
8.11%
Ranking of countries by current statistics by years


Comments: