29
/
en
AIzaSyAYiBZKx7MnpbEhh9jyipgxe19OcubqV5w
April 1, 2024
126463
El Salvador
SLV
true
2
1
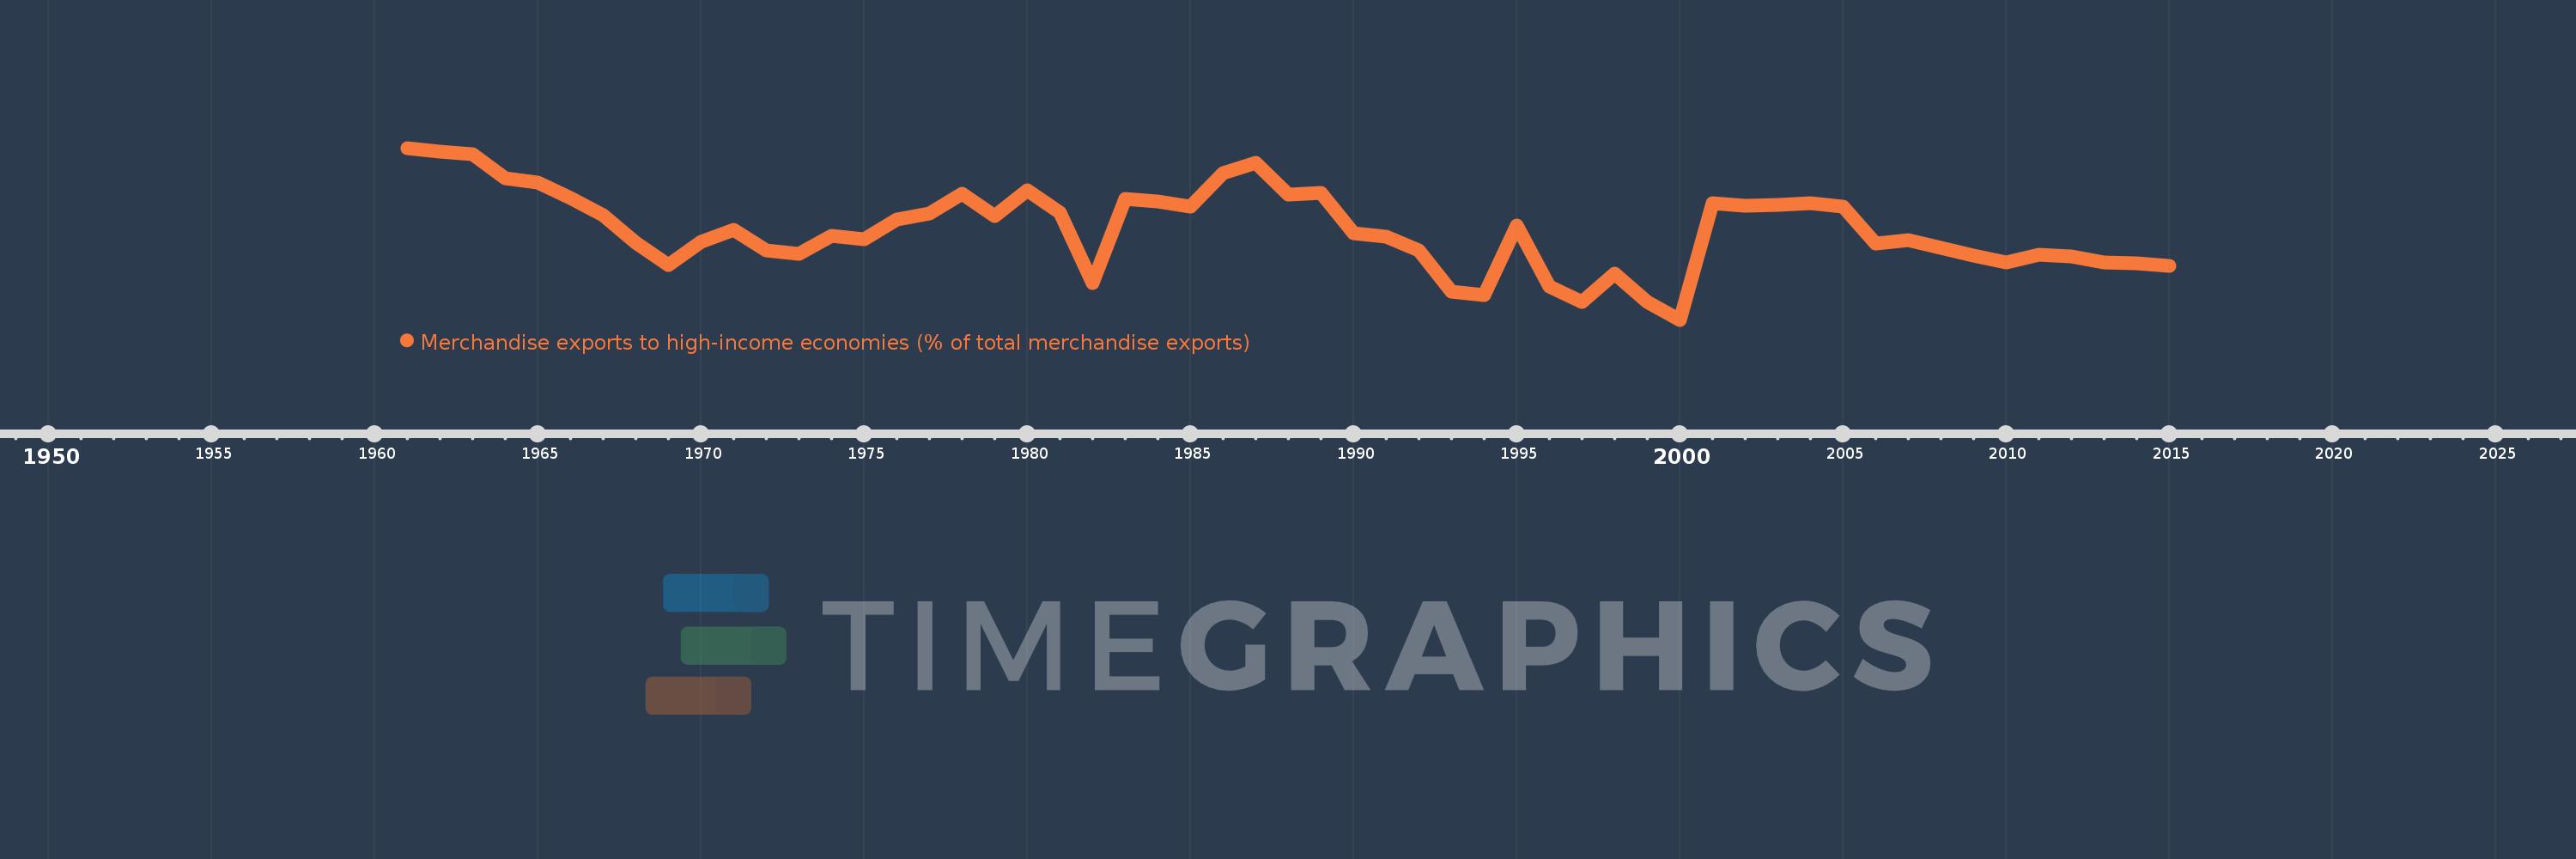
Merchandise exports to high-income economies (% of total merchandise exports)
2015,2014,2013,2012,2011,2010,2009,2008,2007,2006,2005,2004,2003,2002,2001,2000,1999,1998,1997,1996,1995,1994,1993,1992,1991,1990,1989,1988,1987,1986,1985,1984,1983,1982,1981,1980,1979,1978,1977,1976,1975,1974,1973,1972,1971,1970,1969,1968,1967,1966,1965,1964,1963,1962,1961
This statistics in other country:
AfghanistanAlbaniaAlgeriaAmerican SamoaAngolaAntigua and BarbudaArab WorldArgentinaArmeniaArubaAustraliaAustriaAzerbaijanBahamas, TheBahrainBangladeshBarbadosBelarusBelgiumBelizeBeninBermudaBoliviaBosnia and HerzegovinaBrazilBrunei DarussalamBulgariaBurkina FasoBurundiCabo VerdeCambodiaCameroonCanadaCaribbean small statesCentral African RepublicCentral Europe and the BalticsChadChileChinaColombiaComorosCongo, Dem. Rep.Congo, Rep.Costa RicaCote d'IvoireCroatiaCubaCyprusCzech RepublicDenmarkDjiboutiDominicaDominican RepublicEarly-demographic dividendEast Asia & PacificEast Asia & Pacific (excluding high income)East Asia & Pacific (IDA & IBRD countries)EcuadorEgypt, Arab Rep.El SalvadorEquatorial GuineaEstoniaEthiopiaEuro areaEurope & Central AsiaEurope & Central Asia (excluding high income)Europe & Central Asia (IDA & IBRD countries)European UnionFaroe IslandsFijiFinlandFragile and conflict affected situationsFranceFrench PolynesiaGabonGambia, TheGeorgiaGermanyGhanaGibraltarGreeceGreenlandGrenadaGuamGuatemalaGuineaGuinea-BissauGuyanaHaitiHeavily indebted poor countries (HIPC)High incomeHondurasHong Kong SAR, ChinaHungaryIBRD onlyIcelandIDA & IBRD totalIDA blendIDA onlyIDA totalIndiaIndonesiaIran, Islamic Rep.IraqIrelandIsraelItalyJamaicaJapanJordanKazakhstanKenyaKiribatiKorea, Dem. People’s Rep.Korea, Rep.KosovoKuwaitKyrgyz RepublicLao PDRLate-demographic dividendLatin America & Caribbean Latin America & Caribbean (excluding high income)Latin America & the Caribbean (IDA & IBRD countries)LatviaLeast developed countries: UN classificationLebanonLiberiaLibyaLithuaniaLow & middle incomeLow incomeLower middle incomeLuxembourgMacao SAR, ChinaMacedonia, FYRMadagascarMalawiMalaysiaMaldivesMaliMaltaMauritaniaMauritiusMexicoMiddle East & North AfricaMiddle East & North Africa (excluding high income)Middle East & North Africa (IDA & IBRD countries)Middle incomeMoldovaMongoliaMontenegroMoroccoMozambiqueMyanmarNauruNepalNetherlandsNew CaledoniaNew ZealandNicaraguaNigerNigeriaNorth AmericaNorwayOECD membersOmanOther small statesPacific island small statesPakistanPanamaPapua New GuineaParaguayPeruPhilippinesPolandPortugalPost-demographic dividendPre-demographic dividendQatarRomaniaRussian FederationRwandaSamoaSao Tome and PrincipeSaudi ArabiaSenegalSerbiaSeychellesSierra LeoneSingaporeSlovak RepublicSloveniaSmall statesSolomon IslandsSomaliaSouth AfricaSouth AsiaSouth Asia (IDA & IBRD)SpainSri LankaSt. Kitts and NevisSt. LuciaSt. Vincent and the GrenadinesSub-Saharan Africa Sub-Saharan Africa (excluding high income)Sub-Saharan Africa (IDA & IBRD countries)SudanSurinameSwedenSwitzerlandSyrian Arab RepublicTajikistanTanzaniaThailandTogoTongaTrinidad and TobagoTunisiaTurkeyTurkmenistanTuvaluUgandaUkraineUnited Arab EmiratesUnited KingdomUnited StatesUpper middle incomeUruguayUzbekistanVanuatuVenezuela, RBVietnamWorldYemen, Rep.ZambiaZimbabwe Timeline:
This timeline shows a graph from 1961 to 2015 of El Salvador. No data until 1960. Number of actual observations by date: 55.
Source name:
World Development Indicators
Source organization:
World Bank staff estimates based data from International Monetary Fund's Direction of Trade database.
Categories, topics:
Private Sector, Trade
Last updated:
apr 23, 2017
Indicators value changes by year
Minimum:
38.772
jan 1, 2000
Maximum:
87.147
jan 1, 1961
At the date of observation
Value
Absolute change
Change from previous value
jan 1, 1961
87.147
+87.147
0.0%
jan 1, 1962
86.074
-1.073
-1.23%
jan 1, 1963
85.473
-0.601
-0.7%
jan 1, 1964
78.636
-6.837
-8.0%
jan 1, 1965
77.372
-1.264
-1.61%
jan 1, 1966
73.142
-4.23
-5.47%
jan 1, 1967
68.194
-4.949
-6.77%
jan 1, 1968
60.445
-7.749
-11.36%
jan 1, 1969
54.226
-6.219
-10.29%
jan 1, 1970
60.601
+6.375
11.76%
jan 1, 1971
64.2
+3.598
5.94%
jan 1, 1972
58.235
-5.964
-9.29%
jan 1, 1973
57.229
-1.006
-1.73%
jan 1, 1974
62.493
+5.264
9.2%
jan 1, 1975
61.492
-1.001
-1.6%
jan 1, 1976
66.938
+5.446
8.86%
jan 1, 1977
68.642
+1.704
2.55%
jan 1, 1978
74.282
+5.64
8.22%
jan 1, 1979
68.014
-6.268
-8.44%
jan 1, 1980
75.21
+7.196
10.58%
jan 1, 1981
69.031
-6.179
-8.22%
jan 1, 1982
49.139
-19.892
-28.82%
jan 1, 1983
72.754
+23.615
48.06%
jan 1, 1984
72.147
-0.607
-0.83%
jan 1, 1985
70.533
-1.614
-2.24%
jan 1, 1986
80.058
+9.525
13.5%
jan 1, 1987
82.895
+2.837
3.54%
jan 1, 1988
74.012
-8.883
-10.72%
jan 1, 1989
74.463
+0.451
0.61%
jan 1, 1990
63.244
-11.219
-15.07%
jan 1, 1991
62.153
-1.091
-1.73%
jan 1, 1992
58.411
-3.741
-6.02%
jan 1, 1993
46.572
-11.84
-20.27%
jan 1, 1994
45.745
-0.827
-1.78%
jan 1, 1995
65.385
+19.641
42.94%
jan 1, 1996
48.172
-17.214
-26.33%
jan 1, 1997
43.774
-4.398
-9.13%
jan 1, 1998
51.657
+7.883
18.01%
jan 1, 1999
43.826
-7.831
-15.16%
jan 1, 2000
38.772
-5.055
-11.53%
jan 1, 2001
71.481
+32.709
84.36%
jan 1, 2002
70.765
-0.716
-1.0%
jan 1, 2003
71.006
+0.241
0.34%
jan 1, 2004
71.583
+0.577
0.81%
jan 1, 2005
70.606
-0.977
-1.37%
jan 1, 2006
60.25
-10.356
-14.67%
jan 1, 2007
61.14
+0.89
1.48%
jan 1, 2008
59.066
-2.074
-3.39%
jan 1, 2009
56.733
-2.333
-3.95%
jan 1, 2010
54.959
-1.774
-3.13%
jan 1, 2011
57.006
+2.047
3.72%
jan 1, 2012
56.711
-0.295
-0.52%
jan 1, 2013
55.014
-1.698
-2.99%
jan 1, 2014
54.589
-0.425
-0.77%
jan 1, 2015
53.956
-0.633
-1.16%
Ranking of countries by current statistics by years


Comments: