29
/
en
AIzaSyAYiBZKx7MnpbEhh9jyipgxe19OcubqV5w
April 1, 2024
56391
Small states
SST
false
2
1
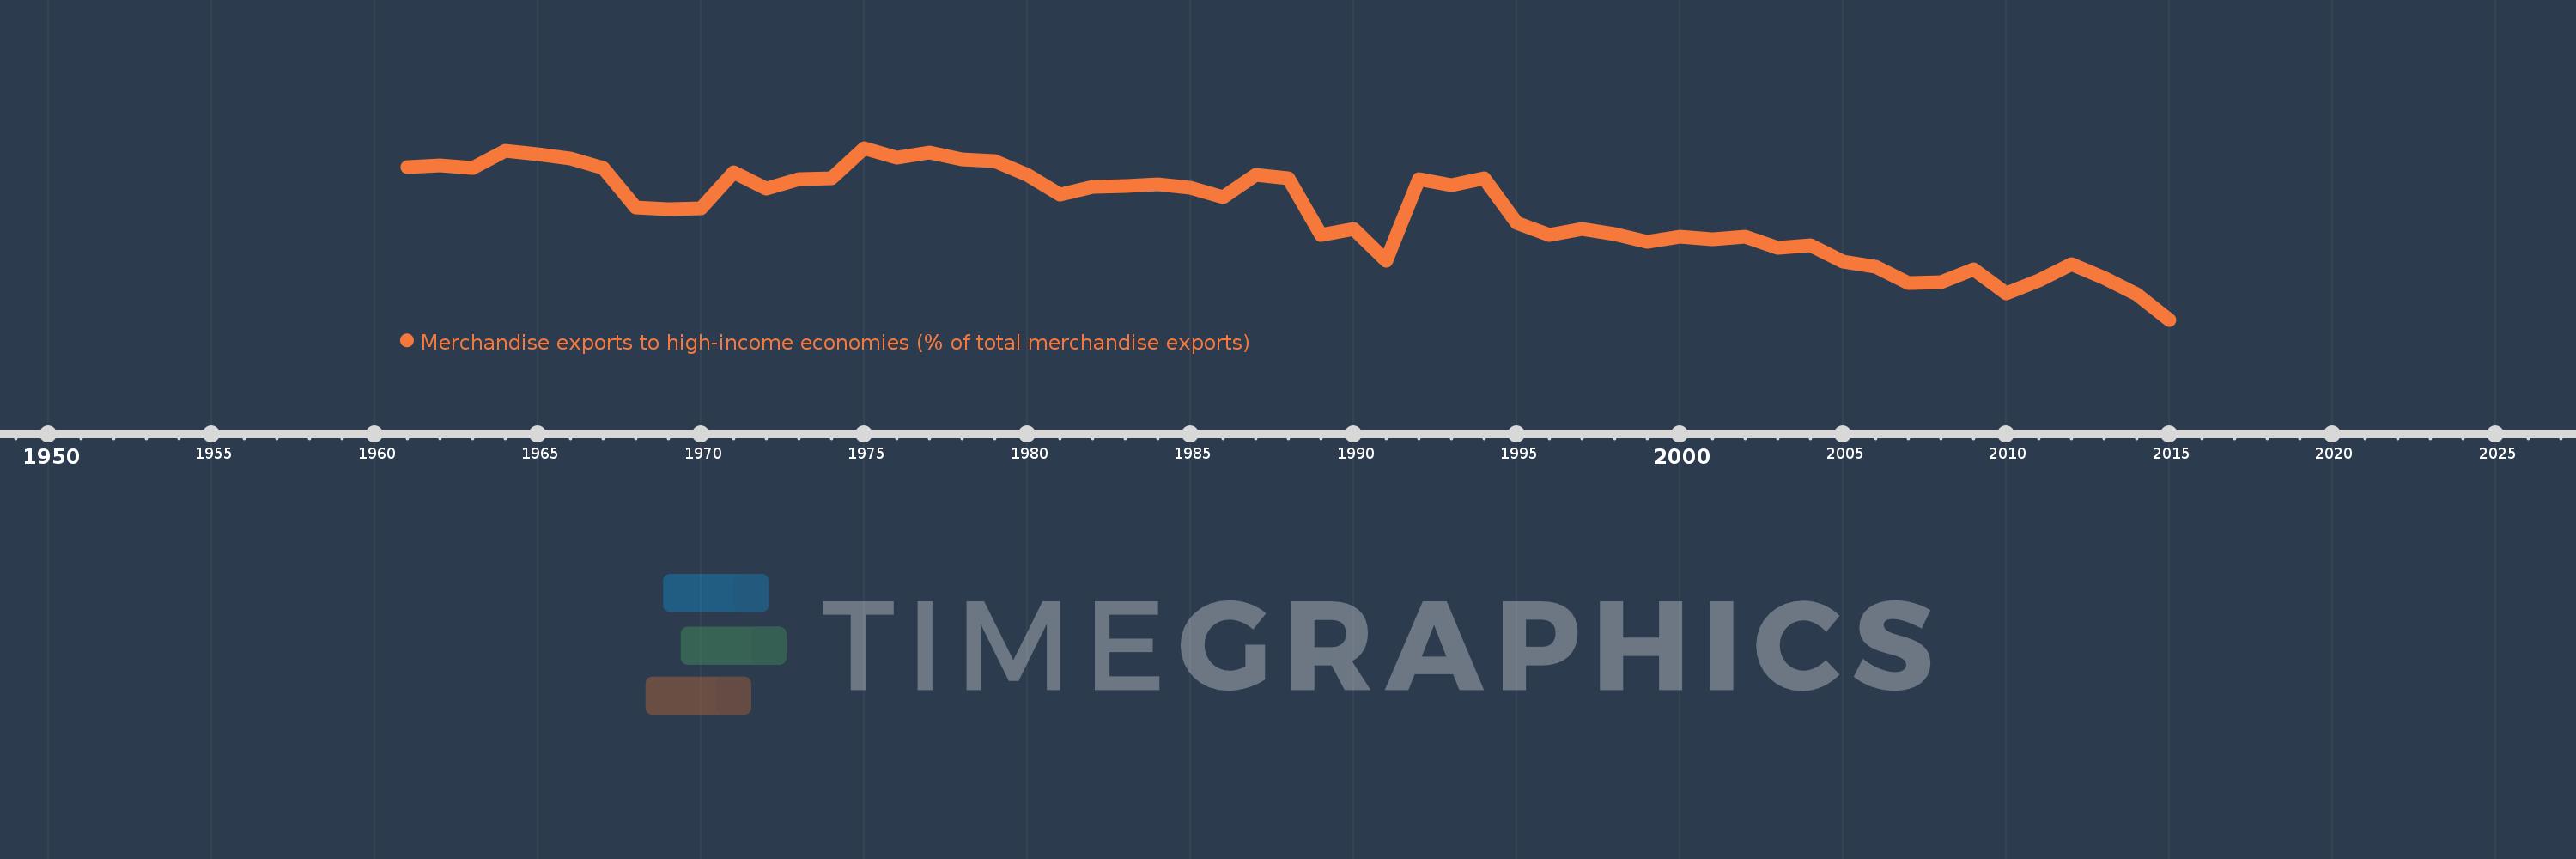
Merchandise exports to high-income economies (% of total merchandise exports)
2015,2014,2013,2012,2011,2010,2009,2008,2007,2006,2005,2004,2003,2002,2001,2000,1999,1998,1997,1996,1995,1994,1993,1992,1991,1990,1989,1988,1987,1986,1985,1984,1983,1982,1981,1980,1979,1978,1977,1976,1975,1974,1973,1972,1971,1970,1969,1968,1967,1966,1965,1964,1963,1962,1961
This statistics in other country:
AfghanistanAlbaniaAlgeriaAmerican SamoaAngolaAntigua and BarbudaArab WorldArgentinaArmeniaArubaAustraliaAustriaAzerbaijanBahamas, TheBahrainBangladeshBarbadosBelarusBelgiumBelizeBeninBermudaBoliviaBosnia and HerzegovinaBrazilBrunei DarussalamBulgariaBurkina FasoBurundiCabo VerdeCambodiaCameroonCanadaCaribbean small statesCentral African RepublicCentral Europe and the BalticsChadChileChinaColombiaComorosCongo, Dem. Rep.Congo, Rep.Costa RicaCote d'IvoireCroatiaCubaCyprusCzech RepublicDenmarkDjiboutiDominicaDominican RepublicEarly-demographic dividendEast Asia & PacificEast Asia & Pacific (excluding high income)East Asia & Pacific (IDA & IBRD countries)EcuadorEgypt, Arab Rep.El SalvadorEquatorial GuineaEstoniaEthiopiaEuro areaEurope & Central AsiaEurope & Central Asia (excluding high income)Europe & Central Asia (IDA & IBRD countries)European UnionFaroe IslandsFijiFinlandFragile and conflict affected situationsFranceFrench PolynesiaGabonGambia, TheGeorgiaGermanyGhanaGibraltarGreeceGreenlandGrenadaGuamGuatemalaGuineaGuinea-BissauGuyanaHaitiHeavily indebted poor countries (HIPC)High incomeHondurasHong Kong SAR, ChinaHungaryIBRD onlyIcelandIDA & IBRD totalIDA blendIDA onlyIDA totalIndiaIndonesiaIran, Islamic Rep.IraqIrelandIsraelItalyJamaicaJapanJordanKazakhstanKenyaKiribatiKorea, Dem. People’s Rep.Korea, Rep.KosovoKuwaitKyrgyz RepublicLao PDRLate-demographic dividendLatin America & Caribbean Latin America & Caribbean (excluding high income)Latin America & the Caribbean (IDA & IBRD countries)LatviaLeast developed countries: UN classificationLebanonLiberiaLibyaLithuaniaLow & middle incomeLow incomeLower middle incomeLuxembourgMacao SAR, ChinaMacedonia, FYRMadagascarMalawiMalaysiaMaldivesMaliMaltaMauritaniaMauritiusMexicoMiddle East & North AfricaMiddle East & North Africa (excluding high income)Middle East & North Africa (IDA & IBRD countries)Middle incomeMoldovaMongoliaMontenegroMoroccoMozambiqueMyanmarNauruNepalNetherlandsNew CaledoniaNew ZealandNicaraguaNigerNigeriaNorth AmericaNorwayOECD membersOmanOther small statesPacific island small statesPakistanPanamaPapua New GuineaParaguayPeruPhilippinesPolandPortugalPost-demographic dividendPre-demographic dividendQatarRomaniaRussian FederationRwandaSamoaSao Tome and PrincipeSaudi ArabiaSenegalSerbiaSeychellesSierra LeoneSingaporeSlovak RepublicSloveniaSmall statesSolomon IslandsSomaliaSouth AfricaSouth AsiaSouth Asia (IDA & IBRD)SpainSri LankaSt. Kitts and NevisSt. LuciaSt. Vincent and the GrenadinesSub-Saharan Africa Sub-Saharan Africa (excluding high income)Sub-Saharan Africa (IDA & IBRD countries)SudanSurinameSwedenSwitzerlandSyrian Arab RepublicTajikistanTanzaniaThailandTogoTongaTrinidad and TobagoTunisiaTurkeyTurkmenistanTuvaluUgandaUkraineUnited Arab EmiratesUnited KingdomUnited StatesUpper middle incomeUruguayUzbekistanVanuatuVenezuela, RBVietnamWorldYemen, Rep.ZambiaZimbabwe Timeline:
This timeline shows a graph from 1961 to 2015 of Small states. No data until 1960. Number of actual observations by date: 55.
Source name:
World Development Indicators
Source organization:
World Bank staff estimates based data from International Monetary Fund's Direction of Trade database.
Categories, topics:
Private Sector, Trade
Last updated:
apr 23, 2017
Indicators value changes by year
Minimum:
62.261
jan 1, 2015
Maximum:
85.851
jan 1, 1975
At the date of observation
Value
Absolute change
Change from previous value
jan 1, 1961
83.252
+83.252
0.0%
jan 1, 1962
83.406
+0.153
0.18%
jan 1, 1963
83.049
-0.356
-0.43%
jan 1, 1964
85.494
+2.445
2.94%
jan 1, 1965
85.036
-0.458
-0.54%
jan 1, 1966
84.44
-0.597
-0.7%
jan 1, 1967
83.08
-1.36
-1.61%
jan 1, 1968
77.707
-5.373
-6.47%
jan 1, 1969
77.434
-0.273
-0.35%
jan 1, 1970
77.501
+0.067
0.09%
jan 1, 1971
82.462
+4.961
6.4%
jan 1, 1972
80.286
-2.176
-2.64%
jan 1, 1973
81.521
+1.235
1.54%
jan 1, 1974
81.719
+0.198
0.24%
jan 1, 1975
85.851
+4.132
5.06%
jan 1, 1976
84.493
-1.359
-1.58%
jan 1, 1977
85.281
+0.789
0.93%
jan 1, 1978
84.287
-0.995
-1.17%
jan 1, 1979
84.031
-0.256
-0.3%
jan 1, 1980
82.12
-1.911
-2.27%
jan 1, 1981
79.434
-2.685
-3.27%
jan 1, 1982
80.562
+1.128
1.42%
jan 1, 1983
80.603
+0.041
0.05%
jan 1, 1984
80.915
+0.313
0.39%
jan 1, 1985
80.37
-0.546
-0.67%
jan 1, 1986
79.082
-1.288
-1.6%
jan 1, 1987
82.215
+3.134
3.96%
jan 1, 1988
81.706
-0.509
-0.62%
jan 1, 1989
73.898
-7.808
-9.56%
jan 1, 1990
74.753
+0.855
1.16%
jan 1, 1991
70.368
-4.385
-5.87%
jan 1, 1992
81.612
+11.245
15.98%
jan 1, 1993
80.755
-0.857
-1.05%
jan 1, 1994
81.679
+0.924
1.14%
jan 1, 1995
75.553
-6.125
-7.5%
jan 1, 1996
73.898
-1.655
-2.19%
jan 1, 1997
74.748
+0.85
1.15%
jan 1, 1998
74.067
-0.681
-0.91%
jan 1, 1999
72.981
-1.086
-1.47%
jan 1, 2000
73.611
+0.63
0.86%
jan 1, 2001
73.37
-0.242
-0.33%
jan 1, 2002
73.626
+0.256
0.35%
jan 1, 2003
72.161
-1.465
-1.99%
jan 1, 2004
72.511
+0.35
0.48%
jan 1, 2005
70.289
-2.222
-3.06%
jan 1, 2006
69.525
-0.763
-1.09%
jan 1, 2007
67.318
-2.207
-3.17%
jan 1, 2008
67.377
+0.059
0.09%
jan 1, 2009
69.192
+1.814
2.69%
jan 1, 2010
65.909
-3.282
-4.74%
jan 1, 2011
67.638
+1.728
2.62%
jan 1, 2012
69.922
+2.285
3.38%
jan 1, 2013
68.023
-1.899
-2.72%
jan 1, 2014
65.798
-2.225
-3.27%
jan 1, 2015
62.261
-3.538
-5.38%
Ranking of countries by current statistics by years


Comments: