29
/
en
AIzaSyAYiBZKx7MnpbEhh9jyipgxe19OcubqV5w
April 1, 2024
272528
Uganda
UGA
true
2
1
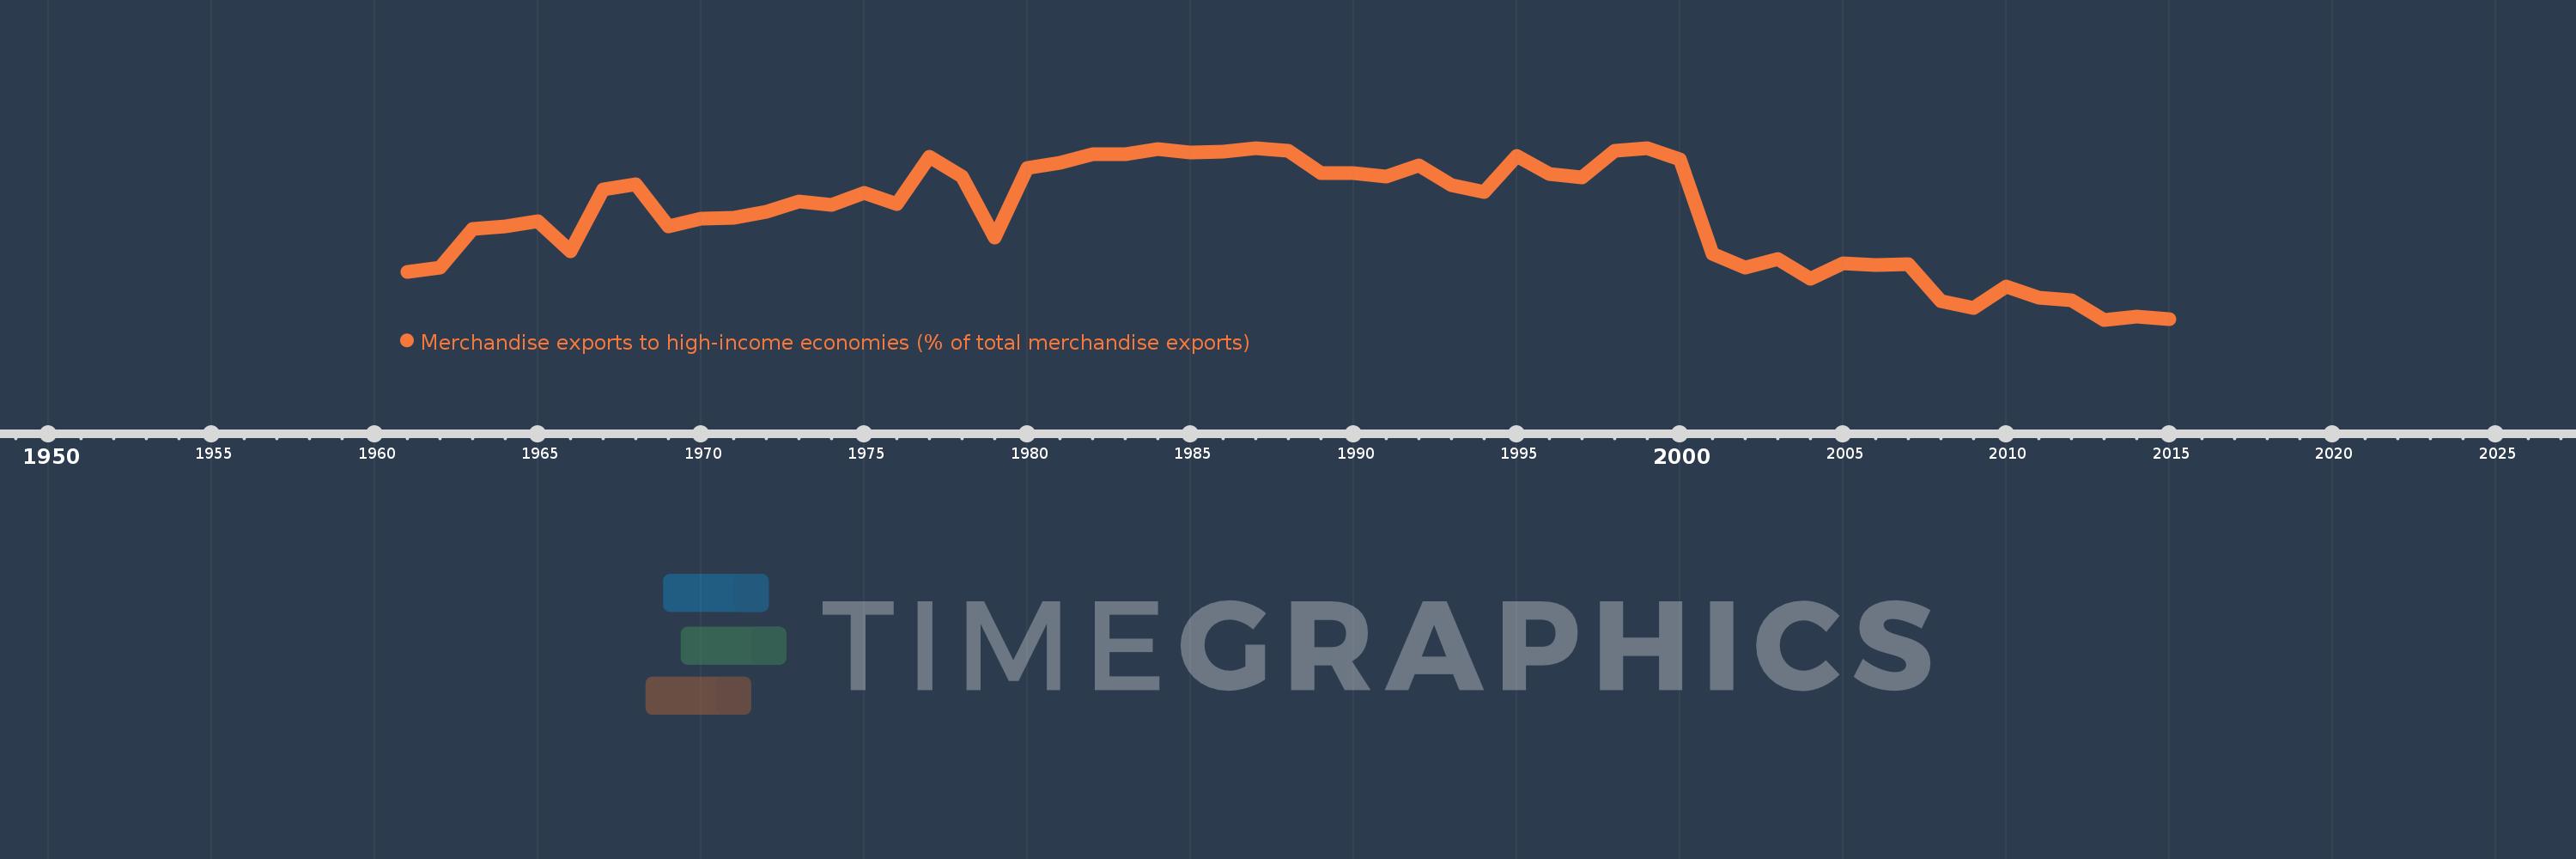
Merchandise exports to high-income economies (% of total merchandise exports)
2015,2014,2013,2012,2011,2010,2009,2008,2007,2006,2005,2004,2003,2002,2001,2000,1999,1998,1997,1996,1995,1994,1993,1992,1991,1990,1989,1988,1987,1986,1985,1984,1983,1982,1981,1980,1979,1978,1977,1976,1975,1974,1973,1972,1971,1970,1969,1968,1967,1966,1965,1964,1963,1962,1961
This statistics in other country:
AfghanistanAlbaniaAlgeriaAmerican SamoaAngolaAntigua and BarbudaArab WorldArgentinaArmeniaArubaAustraliaAustriaAzerbaijanBahamas, TheBahrainBangladeshBarbadosBelarusBelgiumBelizeBeninBermudaBoliviaBosnia and HerzegovinaBrazilBrunei DarussalamBulgariaBurkina FasoBurundiCabo VerdeCambodiaCameroonCanadaCaribbean small statesCentral African RepublicCentral Europe and the BalticsChadChileChinaColombiaComorosCongo, Dem. Rep.Congo, Rep.Costa RicaCote d'IvoireCroatiaCubaCyprusCzech RepublicDenmarkDjiboutiDominicaDominican RepublicEarly-demographic dividendEast Asia & PacificEast Asia & Pacific (excluding high income)East Asia & Pacific (IDA & IBRD countries)EcuadorEgypt, Arab Rep.El SalvadorEquatorial GuineaEstoniaEthiopiaEuro areaEurope & Central AsiaEurope & Central Asia (excluding high income)Europe & Central Asia (IDA & IBRD countries)European UnionFaroe IslandsFijiFinlandFragile and conflict affected situationsFranceFrench PolynesiaGabonGambia, TheGeorgiaGermanyGhanaGibraltarGreeceGreenlandGrenadaGuamGuatemalaGuineaGuinea-BissauGuyanaHaitiHeavily indebted poor countries (HIPC)High incomeHondurasHong Kong SAR, ChinaHungaryIBRD onlyIcelandIDA & IBRD totalIDA blendIDA onlyIDA totalIndiaIndonesiaIran, Islamic Rep.IraqIrelandIsraelItalyJamaicaJapanJordanKazakhstanKenyaKiribatiKorea, Dem. People’s Rep.Korea, Rep.KosovoKuwaitKyrgyz RepublicLao PDRLate-demographic dividendLatin America & Caribbean Latin America & Caribbean (excluding high income)Latin America & the Caribbean (IDA & IBRD countries)LatviaLeast developed countries: UN classificationLebanonLiberiaLibyaLithuaniaLow & middle incomeLow incomeLower middle incomeLuxembourgMacao SAR, ChinaMacedonia, FYRMadagascarMalawiMalaysiaMaldivesMaliMaltaMauritaniaMauritiusMexicoMiddle East & North AfricaMiddle East & North Africa (excluding high income)Middle East & North Africa (IDA & IBRD countries)Middle incomeMoldovaMongoliaMontenegroMoroccoMozambiqueMyanmarNauruNepalNetherlandsNew CaledoniaNew ZealandNicaraguaNigerNigeriaNorth AmericaNorwayOECD membersOmanOther small statesPacific island small statesPakistanPanamaPapua New GuineaParaguayPeruPhilippinesPolandPortugalPost-demographic dividendPre-demographic dividendQatarRomaniaRussian FederationRwandaSamoaSao Tome and PrincipeSaudi ArabiaSenegalSerbiaSeychellesSierra LeoneSingaporeSlovak RepublicSloveniaSmall statesSolomon IslandsSomaliaSouth AfricaSouth AsiaSouth Asia (IDA & IBRD)SpainSri LankaSt. Kitts and NevisSt. LuciaSt. Vincent and the GrenadinesSub-Saharan Africa Sub-Saharan Africa (excluding high income)Sub-Saharan Africa (IDA & IBRD countries)SudanSurinameSwedenSwitzerlandSyrian Arab RepublicTajikistanTanzaniaThailandTogoTongaTrinidad and TobagoTunisiaTurkeyTurkmenistanTuvaluUgandaUkraineUnited Arab EmiratesUnited KingdomUnited StatesUpper middle incomeUruguayUzbekistanVanuatuVenezuela, RBVietnamWorldYemen, Rep.ZambiaZimbabwe Timeline:
This timeline shows a graph from 1961 to 2015 of Uganda. No data until 1960. Number of actual observations by date: 55.
Source name:
World Development Indicators
Source organization:
World Bank staff estimates based data from International Monetary Fund's Direction of Trade database.
Categories, topics:
Private Sector, Trade
Last updated:
apr 23, 2017
Indicators value changes by year
Minimum:
44.244
jan 1, 2013
Maximum:
95.512
jan 1, 1999
At the date of observation
Value
Absolute change
Change from previous value
jan 1, 1961
58.535
+58.535
0.0%
jan 1, 1962
59.739
+1.205
2.06%
jan 1, 1963
71.215
+11.476
19.21%
jan 1, 1964
72.063
+0.848
1.19%
jan 1, 1965
73.534
+1.471
2.04%
jan 1, 1966
64.558
-8.976
-12.21%
jan 1, 1967
83.111
+18.554
28.74%
jan 1, 1968
84.787
+1.676
2.02%
jan 1, 1969
72.165
-12.622
-14.89%
jan 1, 1970
74.307
+2.142
2.97%
jan 1, 1971
74.726
+0.419
0.56%
jan 1, 1972
76.505
+1.779
2.38%
jan 1, 1973
79.447
+2.942
3.84%
jan 1, 1974
78.399
-1.048
-1.32%
jan 1, 1975
81.985
+3.586
4.57%
jan 1, 1976
78.683
-3.301
-4.03%
jan 1, 1977
92.782
+14.099
17.92%
jan 1, 1978
86.973
-5.809
-6.26%
jan 1, 1979
68.722
-18.25
-20.98%
jan 1, 1980
89.599
+20.877
30.38%
jan 1, 1981
91.185
+1.585
1.77%
jan 1, 1982
93.567
+2.382
2.61%
jan 1, 1983
93.565
-0.002
0.0%
jan 1, 1984
95.222
+1.658
1.77%
jan 1, 1985
94.261
-0.961
-1.01%
jan 1, 1986
94.391
+0.13
0.14%
jan 1, 1987
95.392
+1.001
1.06%
jan 1, 1988
94.692
-0.7
-0.73%
jan 1, 1989
88.066
-6.626
-7.0%
jan 1, 1990
88.051
-0.015
-0.02%
jan 1, 1991
86.858
-1.193
-1.36%
jan 1, 1992
90.268
+3.411
3.93%
jan 1, 1993
84.406
-5.862
-6.49%
jan 1, 1994
82.441
-1.965
-2.33%
jan 1, 1995
93.023
+10.581
12.84%
jan 1, 1996
87.859
-5.164
-5.55%
jan 1, 1997
86.602
-1.257
-1.43%
jan 1, 1998
94.79
+8.189
9.46%
jan 1, 1999
95.512
+0.722
0.76%
jan 1, 2000
92.042
-3.47
-3.63%
jan 1, 2001
63.807
-28.235
-30.68%
jan 1, 2002
59.682
-4.125
-6.47%
jan 1, 2003
62.349
+2.667
4.47%
jan 1, 2004
56.412
-5.937
-9.52%
jan 1, 2005
61.01
+4.598
8.15%
jan 1, 2006
60.652
-0.358
-0.59%
jan 1, 2007
60.716
+0.064
0.11%
jan 1, 2008
49.879
-10.837
-17.85%
jan 1, 2009
47.864
-2.015
-4.04%
jan 1, 2010
54.112
+6.249
13.06%
jan 1, 2011
50.759
-3.354
-6.2%
jan 1, 2012
50.034
-0.725
-1.43%
jan 1, 2013
44.244
-5.79
-11.57%
jan 1, 2014
45.067
+0.823
1.86%
jan 1, 2015
44.411
-0.656
-1.46%
Ranking of countries by current statistics by years


Comments: