29
/
en
AIzaSyAYiBZKx7MnpbEhh9jyipgxe19OcubqV5w
April 1, 2024
215520
Oman
OMN
true
2
1
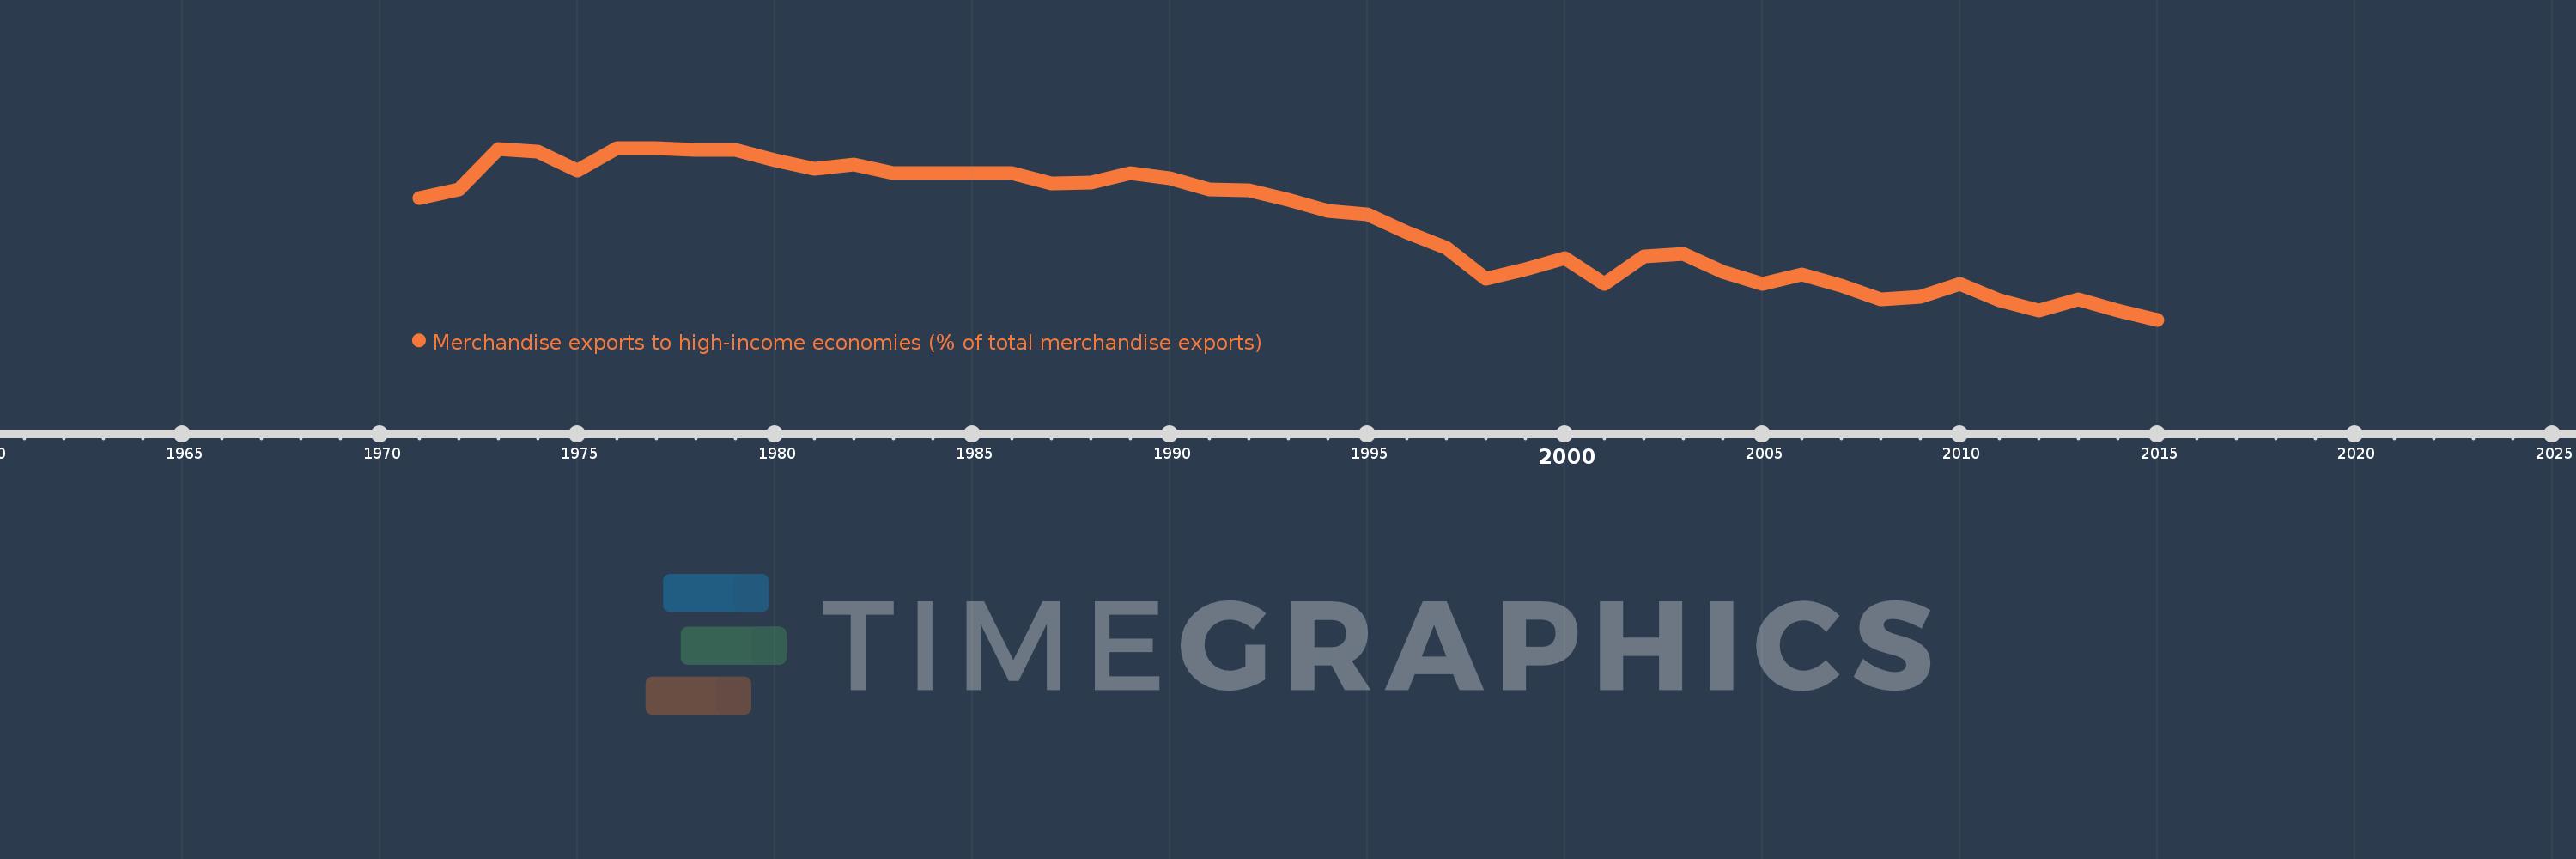
Merchandise exports to high-income economies (% of total merchandise exports)
2015,2014,2013,2012,2011,2010,2009,2008,2007,2006,2005,2004,2003,2002,2001,2000,1999,1998,1997,1996,1995,1994,1993,1992,1991,1990,1989,1988,1987,1986,1985,1984,1983,1982,1981,1980,1979,1978,1977,1976,1975,1974,1973,1972,1971
This statistics in other country:
AfghanistanAlbaniaAlgeriaAmerican SamoaAngolaAntigua and BarbudaArab WorldArgentinaArmeniaArubaAustraliaAustriaAzerbaijanBahamas, TheBahrainBangladeshBarbadosBelarusBelgiumBelizeBeninBermudaBoliviaBosnia and HerzegovinaBrazilBrunei DarussalamBulgariaBurkina FasoBurundiCabo VerdeCambodiaCameroonCanadaCaribbean small statesCentral African RepublicCentral Europe and the BalticsChadChileChinaColombiaComorosCongo, Dem. Rep.Congo, Rep.Costa RicaCote d'IvoireCroatiaCubaCyprusCzech RepublicDenmarkDjiboutiDominicaDominican RepublicEarly-demographic dividendEast Asia & PacificEast Asia & Pacific (excluding high income)East Asia & Pacific (IDA & IBRD countries)EcuadorEgypt, Arab Rep.El SalvadorEquatorial GuineaEstoniaEthiopiaEuro areaEurope & Central AsiaEurope & Central Asia (excluding high income)Europe & Central Asia (IDA & IBRD countries)European UnionFaroe IslandsFijiFinlandFragile and conflict affected situationsFranceFrench PolynesiaGabonGambia, TheGeorgiaGermanyGhanaGibraltarGreeceGreenlandGrenadaGuamGuatemalaGuineaGuinea-BissauGuyanaHaitiHeavily indebted poor countries (HIPC)High incomeHondurasHong Kong SAR, ChinaHungaryIBRD onlyIcelandIDA & IBRD totalIDA blendIDA onlyIDA totalIndiaIndonesiaIran, Islamic Rep.IraqIrelandIsraelItalyJamaicaJapanJordanKazakhstanKenyaKiribatiKorea, Dem. People’s Rep.Korea, Rep.KosovoKuwaitKyrgyz RepublicLao PDRLate-demographic dividendLatin America & Caribbean Latin America & Caribbean (excluding high income)Latin America & the Caribbean (IDA & IBRD countries)LatviaLeast developed countries: UN classificationLebanonLiberiaLibyaLithuaniaLow & middle incomeLow incomeLower middle incomeLuxembourgMacao SAR, ChinaMacedonia, FYRMadagascarMalawiMalaysiaMaldivesMaliMaltaMauritaniaMauritiusMexicoMiddle East & North AfricaMiddle East & North Africa (excluding high income)Middle East & North Africa (IDA & IBRD countries)Middle incomeMoldovaMongoliaMontenegroMoroccoMozambiqueMyanmarNauruNepalNetherlandsNew CaledoniaNew ZealandNicaraguaNigerNigeriaNorth AmericaNorwayOECD membersOmanOther small statesPacific island small statesPakistanPanamaPapua New GuineaParaguayPeruPhilippinesPolandPortugalPost-demographic dividendPre-demographic dividendQatarRomaniaRussian FederationRwandaSamoaSao Tome and PrincipeSaudi ArabiaSenegalSerbiaSeychellesSierra LeoneSingaporeSlovak RepublicSloveniaSmall statesSolomon IslandsSomaliaSouth AfricaSouth AsiaSouth Asia (IDA & IBRD)SpainSri LankaSt. Kitts and NevisSt. LuciaSt. Vincent and the GrenadinesSub-Saharan Africa Sub-Saharan Africa (excluding high income)Sub-Saharan Africa (IDA & IBRD countries)SudanSurinameSwedenSwitzerlandSyrian Arab RepublicTajikistanTanzaniaThailandTogoTongaTrinidad and TobagoTunisiaTurkeyTurkmenistanTuvaluUgandaUkraineUnited Arab EmiratesUnited KingdomUnited StatesUpper middle incomeUruguayUzbekistanVanuatuVenezuela, RBVietnamWorldYemen, Rep.ZambiaZimbabwe Timeline:
This timeline shows a graph from 1971 to 2015 of Oman. No data until 1970. Number of actual observations by date: 45.
Source name:
World Development Indicators
Source organization:
World Bank staff estimates based data from International Monetary Fund's Direction of Trade database.
Categories, topics:
Private Sector, Trade
Last updated:
apr 23, 2017
Indicators value changes by year
Minimum:
39.175
jan 1, 2015
Maximum:
99.985
jan 1, 1976
At the date of observation
Value
Absolute change
Change from previous value
jan 1, 1971
82.289
+82.289
0.0%
jan 1, 1972
85.368
+3.079
3.74%
jan 1, 1973
99.727
+14.36
16.82%
jan 1, 1974
98.606
-1.122
-1.12%
jan 1, 1975
91.93
-6.675
-6.77%
jan 1, 1976
99.985
+8.055
8.76%
jan 1, 1977
99.979
-0.006
-0.01%
jan 1, 1978
99.435
-0.544
-0.54%
jan 1, 1979
99.226
-0.21
-0.21%
jan 1, 1980
95.523
-3.703
-3.73%
jan 1, 1981
92.602
-2.921
-3.06%
jan 1, 1982
94.22
+1.618
1.75%
jan 1, 1983
90.926
-3.295
-3.5%
jan 1, 1984
90.926
+0.0
0.0%
jan 1, 1985
90.926
0.0
0.0%
jan 1, 1986
90.926
0.0
0.0%
jan 1, 1987
87.486
-3.44
-3.78%
jan 1, 1988
87.71
+0.223
0.26%
jan 1, 1989
91.201
+3.491
3.98%
jan 1, 1990
89.368
-1.833
-2.01%
jan 1, 1991
85.152
-4.216
-4.72%
jan 1, 1992
85.096
-0.056
-0.07%
jan 1, 1993
81.574
-3.521
-4.14%
jan 1, 1994
77.658
-3.917
-4.8%
jan 1, 1995
76.531
-1.127
-1.45%
jan 1, 1996
70.16
-6.371
-8.32%
jan 1, 1997
64.691
-5.469
-7.8%
jan 1, 1998
53.757
-10.933
-16.9%
jan 1, 1999
57.075
+3.317
6.17%
jan 1, 2000
61.025
+3.95
6.92%
jan 1, 2001
51.771
-9.254
-15.16%
jan 1, 2002
61.69
+9.919
19.16%
jan 1, 2003
62.415
+0.725
1.18%
jan 1, 2004
56.159
-6.256
-10.02%
jan 1, 2005
51.83
-4.329
-7.71%
jan 1, 2006
55.127
+3.297
6.36%
jan 1, 2007
51.267
-3.86
-7.0%
jan 1, 2008
46.278
-4.988
-9.73%
jan 1, 2009
47.239
+0.961
2.08%
jan 1, 2010
51.913
+4.674
9.9%
jan 1, 2011
46.114
-5.799
-11.17%
jan 1, 2012
42.457
-3.657
-7.93%
jan 1, 2013
46.433
+3.977
9.37%
jan 1, 2014
42.349
-4.085
-8.8%
jan 1, 2015
39.175
-3.174
-7.49%
Ranking of countries by current statistics by years


Comments: