29
/
en
AIzaSyAYiBZKx7MnpbEhh9jyipgxe19OcubqV5w
April 1, 2024
111202
Congo, Rep.
COG
true
2
1
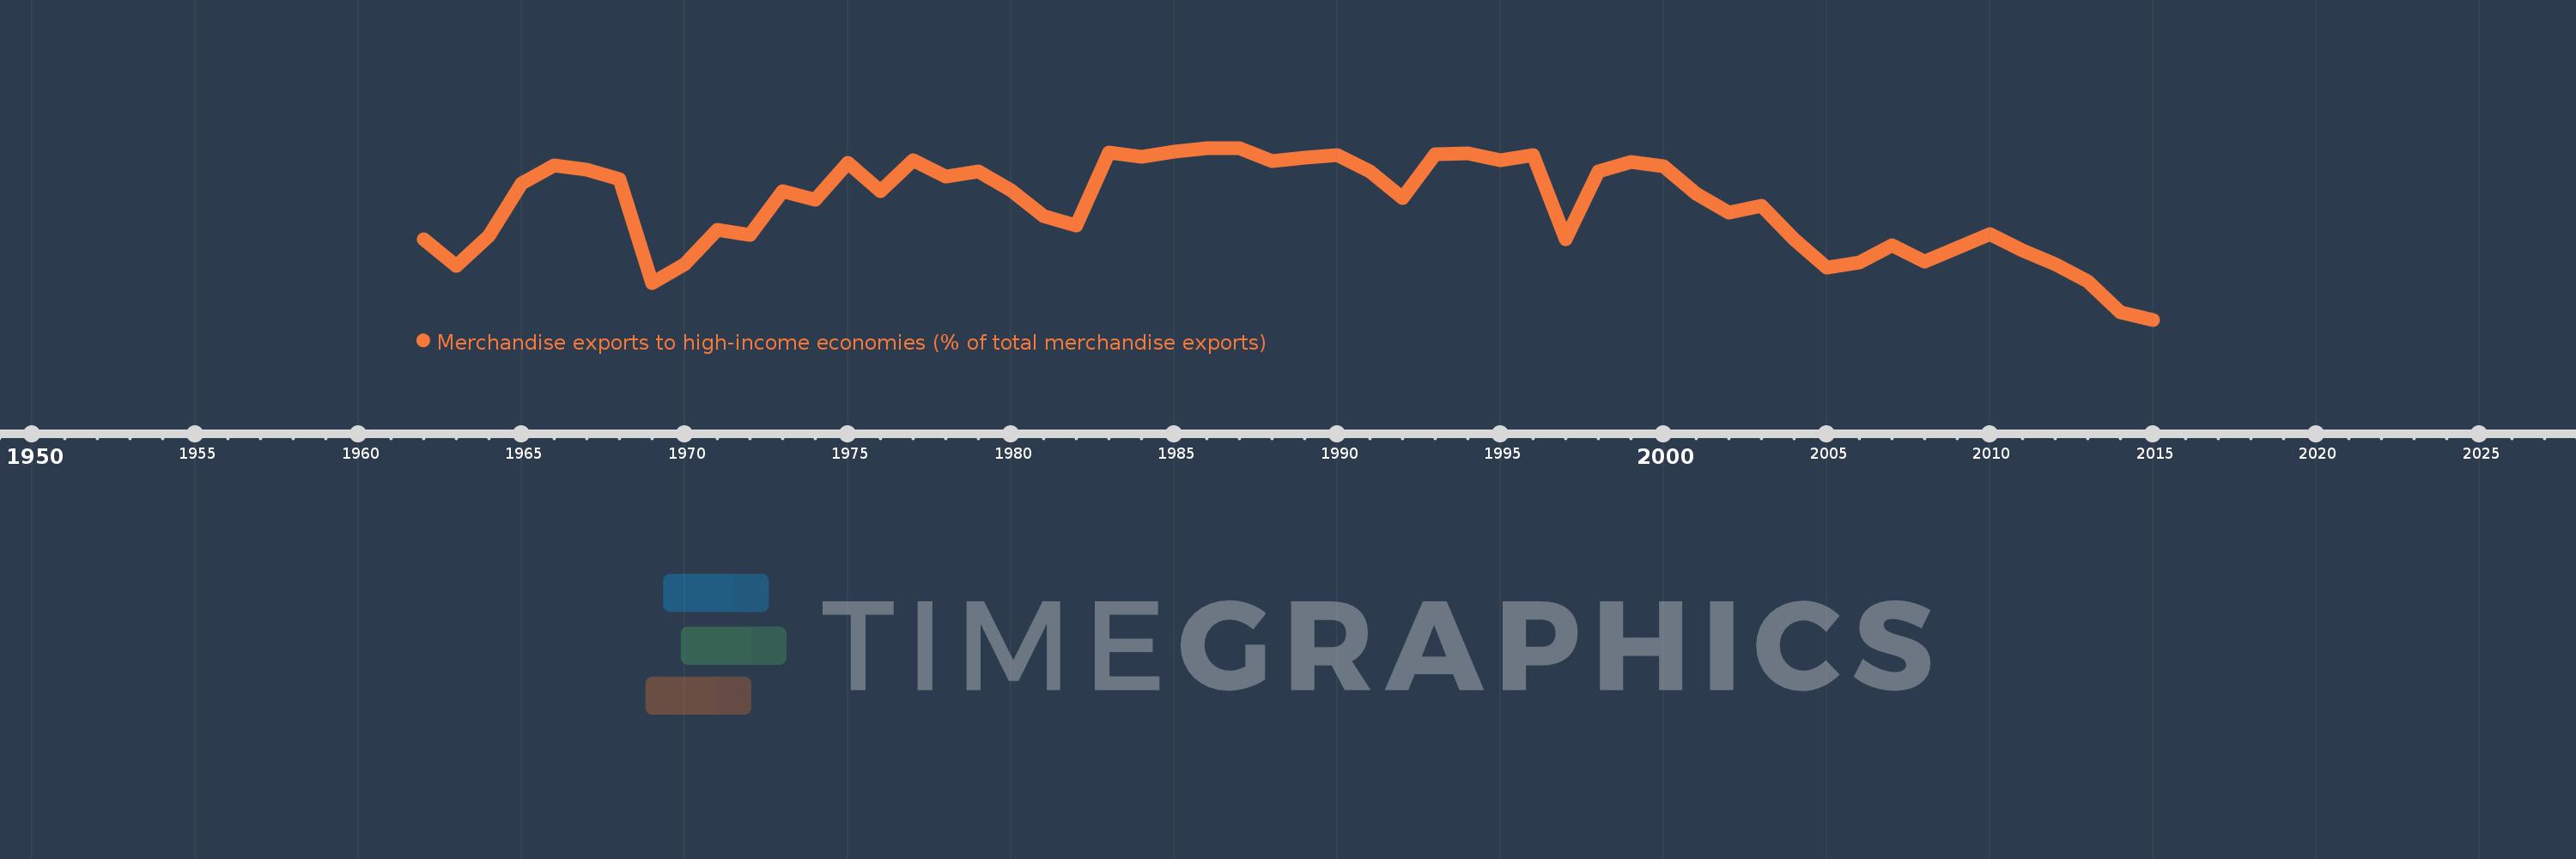
Merchandise exports to high-income economies (% of total merchandise exports)
2015,2014,2013,2012,2011,2010,2009,2008,2007,2006,2005,2004,2003,2002,2001,2000,1999,1998,1997,1996,1995,1994,1993,1992,1991,1990,1989,1988,1987,1986,1985,1984,1983,1982,1981,1980,1979,1978,1977,1976,1975,1974,1973,1972,1971,1970,1969,1968,1967,1966,1965,1964,1963,1962
This statistics in other country:
AfghanistanAlbaniaAlgeriaAmerican SamoaAngolaAntigua and BarbudaArab WorldArgentinaArmeniaArubaAustraliaAustriaAzerbaijanBahamas, TheBahrainBangladeshBarbadosBelarusBelgiumBelizeBeninBermudaBoliviaBosnia and HerzegovinaBrazilBrunei DarussalamBulgariaBurkina FasoBurundiCabo VerdeCambodiaCameroonCanadaCaribbean small statesCentral African RepublicCentral Europe and the BalticsChadChileChinaColombiaComorosCongo, Dem. Rep.Congo, Rep.Costa RicaCote d'IvoireCroatiaCubaCyprusCzech RepublicDenmarkDjiboutiDominicaDominican RepublicEarly-demographic dividendEast Asia & PacificEast Asia & Pacific (excluding high income)East Asia & Pacific (IDA & IBRD countries)EcuadorEgypt, Arab Rep.El SalvadorEquatorial GuineaEstoniaEthiopiaEuro areaEurope & Central AsiaEurope & Central Asia (excluding high income)Europe & Central Asia (IDA & IBRD countries)European UnionFaroe IslandsFijiFinlandFragile and conflict affected situationsFranceFrench PolynesiaGabonGambia, TheGeorgiaGermanyGhanaGibraltarGreeceGreenlandGrenadaGuamGuatemalaGuineaGuinea-BissauGuyanaHaitiHeavily indebted poor countries (HIPC)High incomeHondurasHong Kong SAR, ChinaHungaryIBRD onlyIcelandIDA & IBRD totalIDA blendIDA onlyIDA totalIndiaIndonesiaIran, Islamic Rep.IraqIrelandIsraelItalyJamaicaJapanJordanKazakhstanKenyaKiribatiKorea, Dem. People’s Rep.Korea, Rep.KosovoKuwaitKyrgyz RepublicLao PDRLate-demographic dividendLatin America & Caribbean Latin America & Caribbean (excluding high income)Latin America & the Caribbean (IDA & IBRD countries)LatviaLeast developed countries: UN classificationLebanonLiberiaLibyaLithuaniaLow & middle incomeLow incomeLower middle incomeLuxembourgMacao SAR, ChinaMacedonia, FYRMadagascarMalawiMalaysiaMaldivesMaliMaltaMauritaniaMauritiusMexicoMiddle East & North AfricaMiddle East & North Africa (excluding high income)Middle East & North Africa (IDA & IBRD countries)Middle incomeMoldovaMongoliaMontenegroMoroccoMozambiqueMyanmarNauruNepalNetherlandsNew CaledoniaNew ZealandNicaraguaNigerNigeriaNorth AmericaNorwayOECD membersOmanOther small statesPacific island small statesPakistanPanamaPapua New GuineaParaguayPeruPhilippinesPolandPortugalPost-demographic dividendPre-demographic dividendQatarRomaniaRussian FederationRwandaSamoaSao Tome and PrincipeSaudi ArabiaSenegalSerbiaSeychellesSierra LeoneSingaporeSlovak RepublicSloveniaSmall statesSolomon IslandsSomaliaSouth AfricaSouth AsiaSouth Asia (IDA & IBRD)SpainSri LankaSt. Kitts and NevisSt. LuciaSt. Vincent and the GrenadinesSub-Saharan Africa Sub-Saharan Africa (excluding high income)Sub-Saharan Africa (IDA & IBRD countries)SudanSurinameSwedenSwitzerlandSyrian Arab RepublicTajikistanTanzaniaThailandTogoTongaTrinidad and TobagoTunisiaTurkeyTurkmenistanTuvaluUgandaUkraineUnited Arab EmiratesUnited KingdomUnited StatesUpper middle incomeUruguayUzbekistanVanuatuVenezuela, RBVietnamWorldYemen, Rep.ZambiaZimbabwe Timeline:
This timeline shows a graph from 1962 to 2015 of Congo, Rep.. No data until 1961. Number of actual observations by date: 54.
Source name:
World Development Indicators
Source organization:
World Bank staff estimates based data from International Monetary Fund's Direction of Trade database.
Categories, topics:
Private Sector, Trade
Last updated:
apr 23, 2017
Indicators value changes by year
Minimum:
35.408
jan 1, 2015
Maximum:
95.388
jan 1, 1986
At the date of observation
Value
Absolute change
Change from previous value
jan 1, 1962
63.402
+63.402
0.0%
jan 1, 1963
54.261
-9.141
-14.42%
jan 1, 1964
64.819
+10.558
19.46%
jan 1, 1965
82.875
+18.056
27.86%
jan 1, 1966
89.27
+6.395
7.72%
jan 1, 1967
87.674
-1.596
-1.79%
jan 1, 1968
84.519
-3.156
-3.6%
jan 1, 1969
48.339
-36.18
-42.81%
jan 1, 1970
54.752
+6.413
13.27%
jan 1, 1971
66.879
+12.127
22.15%
jan 1, 1972
65.03
-1.849
-2.76%
jan 1, 1973
80.28
+15.251
23.45%
jan 1, 1974
77.28
-3.0
-3.74%
jan 1, 1975
90.185
+12.904
16.7%
jan 1, 1976
80.298
-9.887
-10.96%
jan 1, 1977
90.95
+10.653
13.27%
jan 1, 1978
85.42
-5.53
-6.08%
jan 1, 1979
87.175
+1.755
2.05%
jan 1, 1980
80.711
-6.465
-7.42%
jan 1, 1981
71.494
-9.217
-11.42%
jan 1, 1982
68.438
-3.056
-4.27%
jan 1, 1983
93.756
+25.318
36.99%
jan 1, 1984
92.231
-1.525
-1.63%
jan 1, 1985
94.112
+1.881
2.04%
jan 1, 1986
95.388
+1.276
1.36%
jan 1, 1987
95.256
-0.133
-0.14%
jan 1, 1988
90.762
-4.494
-4.72%
jan 1, 1989
92.08
+1.318
1.45%
jan 1, 1990
92.811
+0.731
0.79%
jan 1, 1991
87.107
-5.704
-6.15%
jan 1, 1992
77.962
-9.144
-10.5%
jan 1, 1993
93.068
+15.105
19.37%
jan 1, 1994
93.352
+0.284
0.31%
jan 1, 1995
91.146
-2.205
-2.36%
jan 1, 1996
92.819
+1.673
1.84%
jan 1, 1997
63.658
-29.161
-31.42%
jan 1, 1998
87.25
+23.592
37.06%
jan 1, 1999
90.39
+3.14
3.6%
jan 1, 2000
89.132
-1.258
-1.39%
jan 1, 2001
79.404
-9.728
-10.91%
jan 1, 2002
72.911
-6.493
-8.18%
jan 1, 2003
75.162
+2.251
3.09%
jan 1, 2004
63.538
-11.624
-15.47%
jan 1, 2005
53.645
-9.893
-15.57%
jan 1, 2006
55.308
+1.663
3.1%
jan 1, 2007
61.304
+5.997
10.84%
jan 1, 2008
55.641
-5.663
-9.24%
jan 1, 2009
60.54
+4.899
8.8%
jan 1, 2010
65.241
+4.7
7.76%
jan 1, 2011
59.685
-5.556
-8.52%
jan 1, 2012
54.768
-4.917
-8.24%
jan 1, 2013
48.896
-5.872
-10.72%
jan 1, 2014
38.145
-10.751
-21.99%
jan 1, 2015
35.408
-2.738
-7.18%
Ranking of countries by current statistics by years


Comments: