29
/
en
AIzaSyAYiBZKx7MnpbEhh9jyipgxe19OcubqV5w
April 1, 2024
211973
Niger
NER
true
2
1
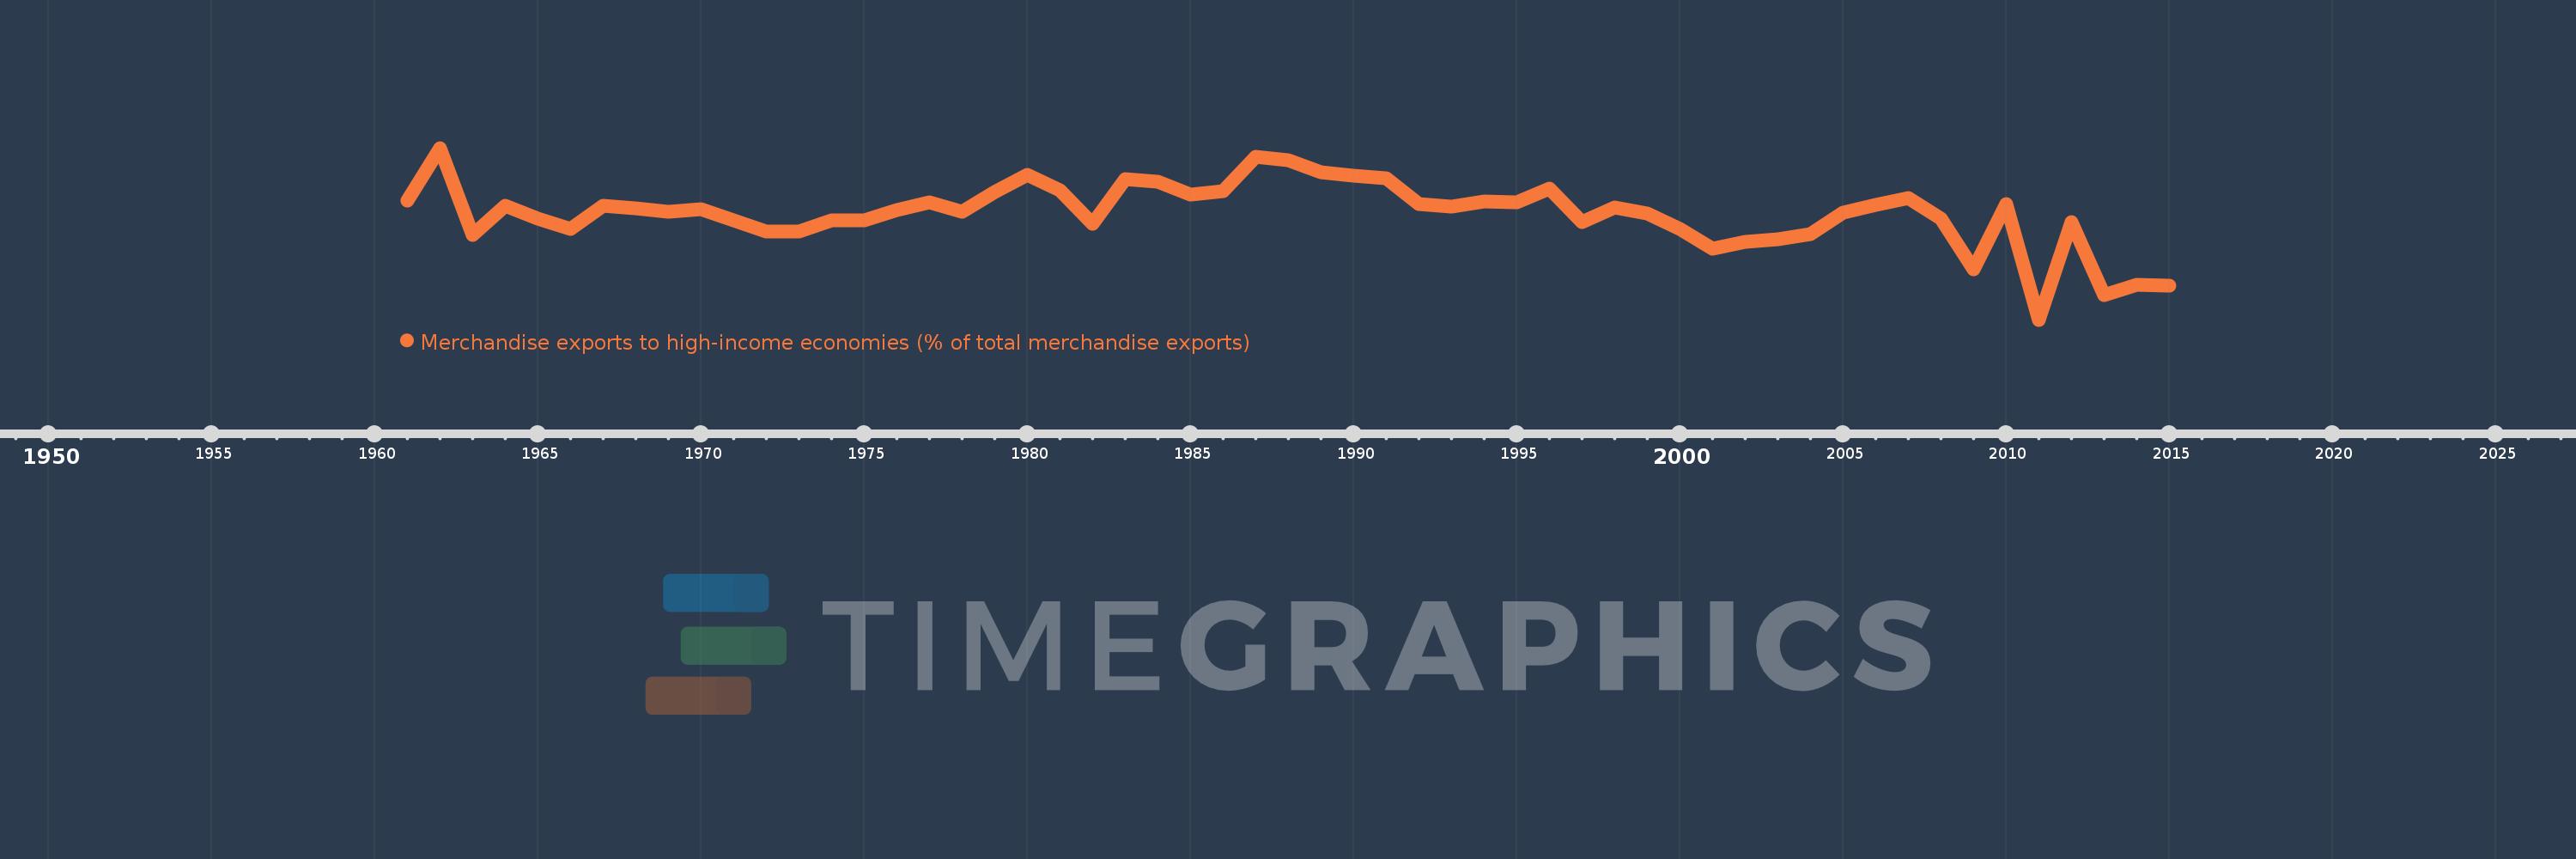
Merchandise exports to high-income economies (% of total merchandise exports)
2015,2014,2013,2012,2011,2010,2009,2008,2007,2006,2005,2004,2003,2002,2001,2000,1999,1998,1997,1996,1995,1994,1993,1992,1991,1990,1989,1988,1987,1986,1985,1984,1983,1982,1981,1980,1979,1978,1977,1976,1975,1974,1973,1972,1971,1970,1969,1968,1967,1966,1965,1964,1963,1962,1961
This statistics in other country:
AfghanistanAlbaniaAlgeriaAmerican SamoaAngolaAntigua and BarbudaArab WorldArgentinaArmeniaArubaAustraliaAustriaAzerbaijanBahamas, TheBahrainBangladeshBarbadosBelarusBelgiumBelizeBeninBermudaBoliviaBosnia and HerzegovinaBrazilBrunei DarussalamBulgariaBurkina FasoBurundiCabo VerdeCambodiaCameroonCanadaCaribbean small statesCentral African RepublicCentral Europe and the BalticsChadChileChinaColombiaComorosCongo, Dem. Rep.Congo, Rep.Costa RicaCote d'IvoireCroatiaCubaCyprusCzech RepublicDenmarkDjiboutiDominicaDominican RepublicEarly-demographic dividendEast Asia & PacificEast Asia & Pacific (excluding high income)East Asia & Pacific (IDA & IBRD countries)EcuadorEgypt, Arab Rep.El SalvadorEquatorial GuineaEstoniaEthiopiaEuro areaEurope & Central AsiaEurope & Central Asia (excluding high income)Europe & Central Asia (IDA & IBRD countries)European UnionFaroe IslandsFijiFinlandFragile and conflict affected situationsFranceFrench PolynesiaGabonGambia, TheGeorgiaGermanyGhanaGibraltarGreeceGreenlandGrenadaGuamGuatemalaGuineaGuinea-BissauGuyanaHaitiHeavily indebted poor countries (HIPC)High incomeHondurasHong Kong SAR, ChinaHungaryIBRD onlyIcelandIDA & IBRD totalIDA blendIDA onlyIDA totalIndiaIndonesiaIran, Islamic Rep.IraqIrelandIsraelItalyJamaicaJapanJordanKazakhstanKenyaKiribatiKorea, Dem. People’s Rep.Korea, Rep.KosovoKuwaitKyrgyz RepublicLao PDRLate-demographic dividendLatin America & Caribbean Latin America & Caribbean (excluding high income)Latin America & the Caribbean (IDA & IBRD countries)LatviaLeast developed countries: UN classificationLebanonLiberiaLibyaLithuaniaLow & middle incomeLow incomeLower middle incomeLuxembourgMacao SAR, ChinaMacedonia, FYRMadagascarMalawiMalaysiaMaldivesMaliMaltaMauritaniaMauritiusMexicoMiddle East & North AfricaMiddle East & North Africa (excluding high income)Middle East & North Africa (IDA & IBRD countries)Middle incomeMoldovaMongoliaMontenegroMoroccoMozambiqueMyanmarNauruNepalNetherlandsNew CaledoniaNew ZealandNicaraguaNigerNigeriaNorth AmericaNorwayOECD membersOmanOther small statesPacific island small statesPakistanPanamaPapua New GuineaParaguayPeruPhilippinesPolandPortugalPost-demographic dividendPre-demographic dividendQatarRomaniaRussian FederationRwandaSamoaSao Tome and PrincipeSaudi ArabiaSenegalSerbiaSeychellesSierra LeoneSingaporeSlovak RepublicSloveniaSmall statesSolomon IslandsSomaliaSouth AfricaSouth AsiaSouth Asia (IDA & IBRD)SpainSri LankaSt. Kitts and NevisSt. LuciaSt. Vincent and the GrenadinesSub-Saharan Africa Sub-Saharan Africa (excluding high income)Sub-Saharan Africa (IDA & IBRD countries)SudanSurinameSwedenSwitzerlandSyrian Arab RepublicTajikistanTanzaniaThailandTogoTongaTrinidad and TobagoTunisiaTurkeyTurkmenistanTuvaluUgandaUkraineUnited Arab EmiratesUnited KingdomUnited StatesUpper middle incomeUruguayUzbekistanVanuatuVenezuela, RBVietnamWorldYemen, Rep.ZambiaZimbabwe Timeline:
This timeline shows a graph from 1961 to 2015 of Niger. No data until 1960. Number of actual observations by date: 55.
Source name:
World Development Indicators
Source organization:
World Bank staff estimates based data from International Monetary Fund's Direction of Trade database.
Categories, topics:
Private Sector, Trade
Last updated:
apr 23, 2017
Indicators value changes by year
Minimum:
16.618
jan 1, 2011
At the date of observation
Value
Absolute change
Change from previous value
jan 1, 1961
74.4
+74.4
0.0%
jan 1, 1962
100.0
+25.6
34.41%
jan 1, 1963
57.639
-42.361
-42.36%
jan 1, 1964
71.939
+14.3
24.81%
jan 1, 1965
65.566
-6.373
-8.86%
jan 1, 1966
60.714
-4.852
-7.4%
jan 1, 1967
71.839
+11.125
18.32%
jan 1, 1968
70.866
-0.973
-1.35%
jan 1, 1969
68.953
-1.913
-2.7%
jan 1, 1970
70.317
+1.364
1.98%
jan 1, 1971
64.887
-5.43
-7.72%
jan 1, 1972
59.265
-5.622
-8.66%
jan 1, 1973
59.332
+0.067
0.11%
jan 1, 1974
65.054
+5.722
9.64%
jan 1, 1975
64.842
-0.212
-0.33%
jan 1, 1976
69.953
+5.111
7.88%
jan 1, 1977
73.434
+3.481
4.98%
jan 1, 1978
68.919
-4.515
-6.15%
jan 1, 1979
78.711
+9.791
14.21%
jan 1, 1980
86.756
+8.046
10.22%
jan 1, 1981
79.411
-7.345
-8.47%
jan 1, 1982
63.081
-16.33
-20.56%
jan 1, 1983
84.816
+21.736
34.46%
jan 1, 1984
83.759
-1.057
-1.25%
jan 1, 1985
77.449
-6.31
-7.53%
jan 1, 1986
79.004
+1.555
2.01%
jan 1, 1987
95.658
+16.654
21.08%
jan 1, 1988
94.148
-1.51
-1.58%
jan 1, 1989
88.066
-6.082
-6.46%
jan 1, 1990
86.728
-1.339
-1.52%
jan 1, 1991
85.227
-1.5
-1.73%
jan 1, 1992
72.861
-12.366
-14.51%
jan 1, 1993
71.393
-1.468
-2.01%
jan 1, 1994
73.826
+2.433
3.41%
jan 1, 1995
73.658
-0.168
-0.23%
jan 1, 1996
80.192
+6.534
8.87%
jan 1, 1997
63.816
-16.376
-20.42%
jan 1, 1998
71.171
+7.355
11.53%
jan 1, 1999
68.013
-3.158
-4.44%
jan 1, 2000
60.607
-7.406
-10.89%
jan 1, 2001
51.045
-9.562
-15.78%
jan 1, 2002
54.307
+3.262
6.39%
jan 1, 2003
55.73
+1.423
2.62%
jan 1, 2004
58.243
+2.513
4.51%
jan 1, 2005
68.4
+10.157
17.44%
jan 1, 2006
72.47
+4.07
5.95%
jan 1, 2007
75.63
+3.16
4.36%
jan 1, 2008
65.879
-9.751
-12.89%
jan 1, 2009
41.154
-24.724
-37.53%
jan 1, 2010
72.712
+31.557
76.68%
jan 1, 2011
16.618
-56.093
-77.14%
jan 1, 2012
63.88
+47.262
284.4%
jan 1, 2013
28.67
-35.211
-55.12%
jan 1, 2014
33.422
+4.752
16.57%
jan 1, 2015
33.277
-0.145
-0.43%
Ranking of countries by current statistics by years


Comments: