29
/
en
AIzaSyAYiBZKx7MnpbEhh9jyipgxe19OcubqV5w
April 1, 2024
85279
Bermuda
BMU
true
2
1
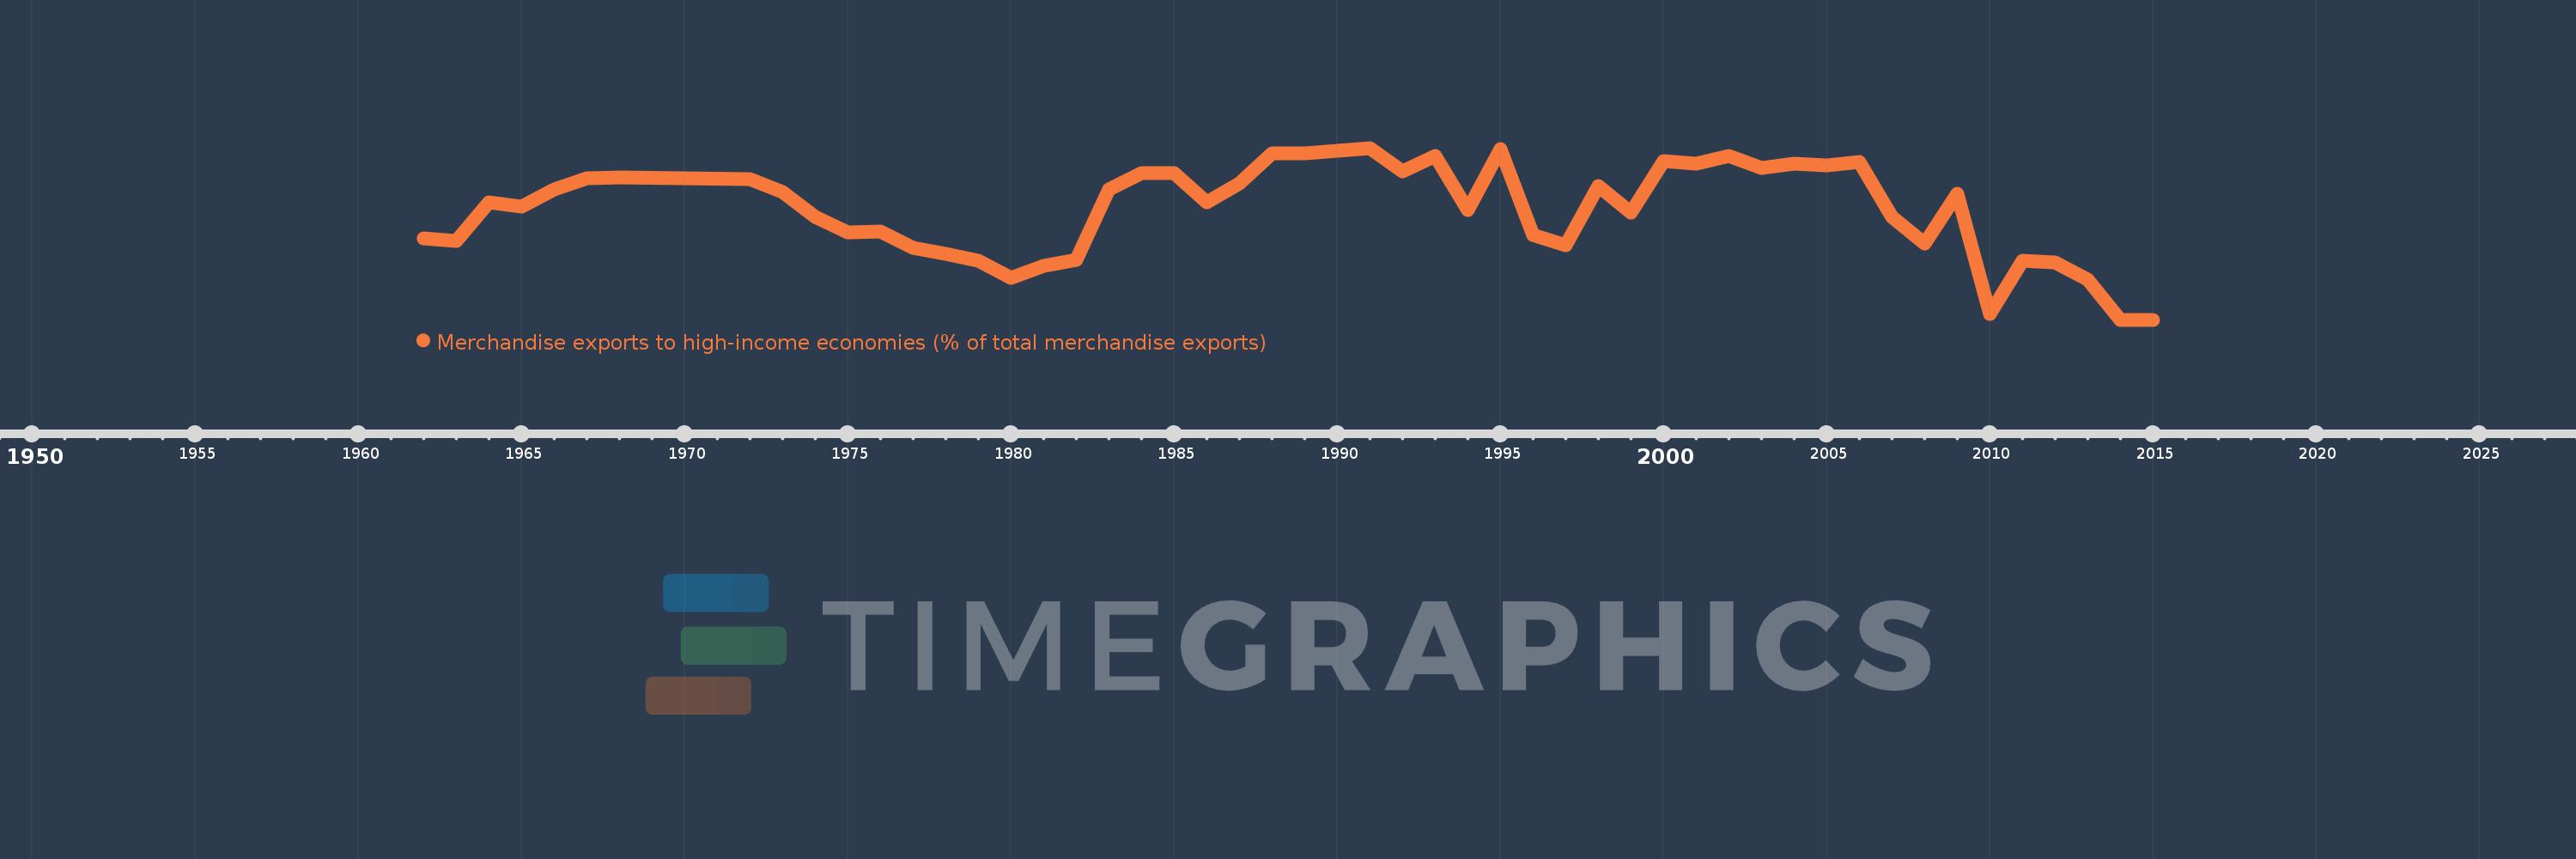
Merchandise exports to high-income economies (% of total merchandise exports)
2015,2014,2013,2012,2011,2010,2009,2008,2007,2006,2005,2004,2003,2002,2001,2000,1999,1998,1997,1996,1995,1994,1993,1992,1991,1990,1989,1988,1987,1986,1985,1984,1983,1982,1981,1980,1979,1978,1977,1976,1975,1974,1973,1972,1968,1967,1966,1965,1964,1963,1962
This statistics in other country:
AfghanistanAlbaniaAlgeriaAmerican SamoaAngolaAntigua and BarbudaArab WorldArgentinaArmeniaArubaAustraliaAustriaAzerbaijanBahamas, TheBahrainBangladeshBarbadosBelarusBelgiumBelizeBeninBermudaBoliviaBosnia and HerzegovinaBrazilBrunei DarussalamBulgariaBurkina FasoBurundiCabo VerdeCambodiaCameroonCanadaCaribbean small statesCentral African RepublicCentral Europe and the BalticsChadChileChinaColombiaComorosCongo, Dem. Rep.Congo, Rep.Costa RicaCote d'IvoireCroatiaCubaCyprusCzech RepublicDenmarkDjiboutiDominicaDominican RepublicEarly-demographic dividendEast Asia & PacificEast Asia & Pacific (excluding high income)East Asia & Pacific (IDA & IBRD countries)EcuadorEgypt, Arab Rep.El SalvadorEquatorial GuineaEstoniaEthiopiaEuro areaEurope & Central AsiaEurope & Central Asia (excluding high income)Europe & Central Asia (IDA & IBRD countries)European UnionFaroe IslandsFijiFinlandFragile and conflict affected situationsFranceFrench PolynesiaGabonGambia, TheGeorgiaGermanyGhanaGibraltarGreeceGreenlandGrenadaGuamGuatemalaGuineaGuinea-BissauGuyanaHaitiHeavily indebted poor countries (HIPC)High incomeHondurasHong Kong SAR, ChinaHungaryIBRD onlyIcelandIDA & IBRD totalIDA blendIDA onlyIDA totalIndiaIndonesiaIran, Islamic Rep.IraqIrelandIsraelItalyJamaicaJapanJordanKazakhstanKenyaKiribatiKorea, Dem. People’s Rep.Korea, Rep.KosovoKuwaitKyrgyz RepublicLao PDRLate-demographic dividendLatin America & Caribbean Latin America & Caribbean (excluding high income)Latin America & the Caribbean (IDA & IBRD countries)LatviaLeast developed countries: UN classificationLebanonLiberiaLibyaLithuaniaLow & middle incomeLow incomeLower middle incomeLuxembourgMacao SAR, ChinaMacedonia, FYRMadagascarMalawiMalaysiaMaldivesMaliMaltaMauritaniaMauritiusMexicoMiddle East & North AfricaMiddle East & North Africa (excluding high income)Middle East & North Africa (IDA & IBRD countries)Middle incomeMoldovaMongoliaMontenegroMoroccoMozambiqueMyanmarNauruNepalNetherlandsNew CaledoniaNew ZealandNicaraguaNigerNigeriaNorth AmericaNorwayOECD membersOmanOther small statesPacific island small statesPakistanPanamaPapua New GuineaParaguayPeruPhilippinesPolandPortugalPost-demographic dividendPre-demographic dividendQatarRomaniaRussian FederationRwandaSamoaSao Tome and PrincipeSaudi ArabiaSenegalSerbiaSeychellesSierra LeoneSingaporeSlovak RepublicSloveniaSmall statesSolomon IslandsSomaliaSouth AfricaSouth AsiaSouth Asia (IDA & IBRD)SpainSri LankaSt. Kitts and NevisSt. LuciaSt. Vincent and the GrenadinesSub-Saharan Africa Sub-Saharan Africa (excluding high income)Sub-Saharan Africa (IDA & IBRD countries)SudanSurinameSwedenSwitzerlandSyrian Arab RepublicTajikistanTanzaniaThailandTogoTongaTrinidad and TobagoTunisiaTurkeyTurkmenistanTuvaluUgandaUkraineUnited Arab EmiratesUnited KingdomUnited StatesUpper middle incomeUruguayUzbekistanVanuatuVenezuela, RBVietnamWorldYemen, Rep.ZambiaZimbabwe Timeline:
This timeline shows a graph from 1962 to 2015 of Bermuda. No data until 1961. Number of actual observations by date: 51.
Source name:
World Development Indicators
Source organization:
World Bank staff estimates based data from International Monetary Fund's Direction of Trade database.
Categories, topics:
Private Sector, Trade
Last updated:
apr 23, 2017
Indicators value changes by year
Minimum:
13.804
jan 1, 2014
Maximum:
98.972
jan 1, 1991
At the date of observation
Value
Absolute change
Change from previous value
jan 1, 1962
54.198
+54.198
0.0%
jan 1, 1963
52.896
-1.303
-2.4%
jan 1, 1964
72.208
+19.312
36.51%
jan 1, 1965
69.837
-2.371
-3.28%
jan 1, 1966
78.245
+8.408
12.04%
jan 1, 1967
83.738
+5.493
7.02%
jan 1, 1968
84.551
+0.813
0.97%
jan 1, 1972
83.592
-0.959
-1.13%
jan 1, 1973
77.29
-6.302
-7.54%
jan 1, 1974
64.852
-12.438
-16.09%
jan 1, 1975
56.966
-7.886
-12.16%
jan 1, 1976
57.417
+0.451
0.79%
jan 1, 1977
49.469
-7.948
-13.84%
jan 1, 1978
46.511
-2.957
-5.98%
jan 1, 1979
43.009
-3.502
-7.53%
jan 1, 1980
34.647
-8.362
-19.44%
jan 1, 1981
40.494
+5.847
16.88%
jan 1, 1982
43.579
+3.085
7.62%
jan 1, 1983
78.52
+34.942
80.18%
jan 1, 1984
86.687
+8.167
10.4%
jan 1, 1985
86.38
-0.307
-0.35%
jan 1, 1986
72.079
-14.301
-16.56%
jan 1, 1987
81.19
+9.111
12.64%
jan 1, 1988
96.155
+14.965
18.43%
jan 1, 1989
96.303
+0.148
0.15%
jan 1, 1990
97.615
+1.312
1.36%
jan 1, 1991
98.972
+1.358
1.39%
jan 1, 1992
87.381
-11.591
-11.71%
jan 1, 1993
94.806
+7.425
8.5%
jan 1, 1994
67.975
-26.831
-28.3%
jan 1, 1995
98.508
+30.532
44.92%
jan 1, 1996
55.977
-42.53
-43.17%
jan 1, 1997
50.626
-5.351
-9.56%
jan 1, 1998
80.066
+29.44
58.15%
jan 1, 1999
67.015
-13.052
-16.3%
jan 1, 2000
92.628
+25.613
38.22%
jan 1, 2001
91.348
-1.28
-1.38%
jan 1, 2002
94.8
+3.451
3.78%
jan 1, 2003
88.85
-5.95
-6.28%
jan 1, 2004
91.024
+2.174
2.45%
jan 1, 2005
90.153
-0.871
-0.96%
jan 1, 2006
92.204
+2.051
2.27%
jan 1, 2007
64.93
-27.274
-29.58%
jan 1, 2008
51.538
-13.391
-20.62%
jan 1, 2009
76.38
+24.842
48.2%
jan 1, 2010
16.674
-59.706
-78.17%
jan 1, 2011
42.908
+26.234
157.34%
jan 1, 2012
42.146
-0.762
-1.78%
jan 1, 2013
33.641
-8.505
-20.18%
jan 1, 2014
13.804
-19.836
-58.97%
jan 1, 2015
13.883
+0.078
0.57%
Ranking of countries by current statistics by years


Comments: