29
/
en
AIzaSyAYiBZKx7MnpbEhh9jyipgxe19OcubqV5w
April 1, 2024
45291
Low & middle income
LMY
false
2
1
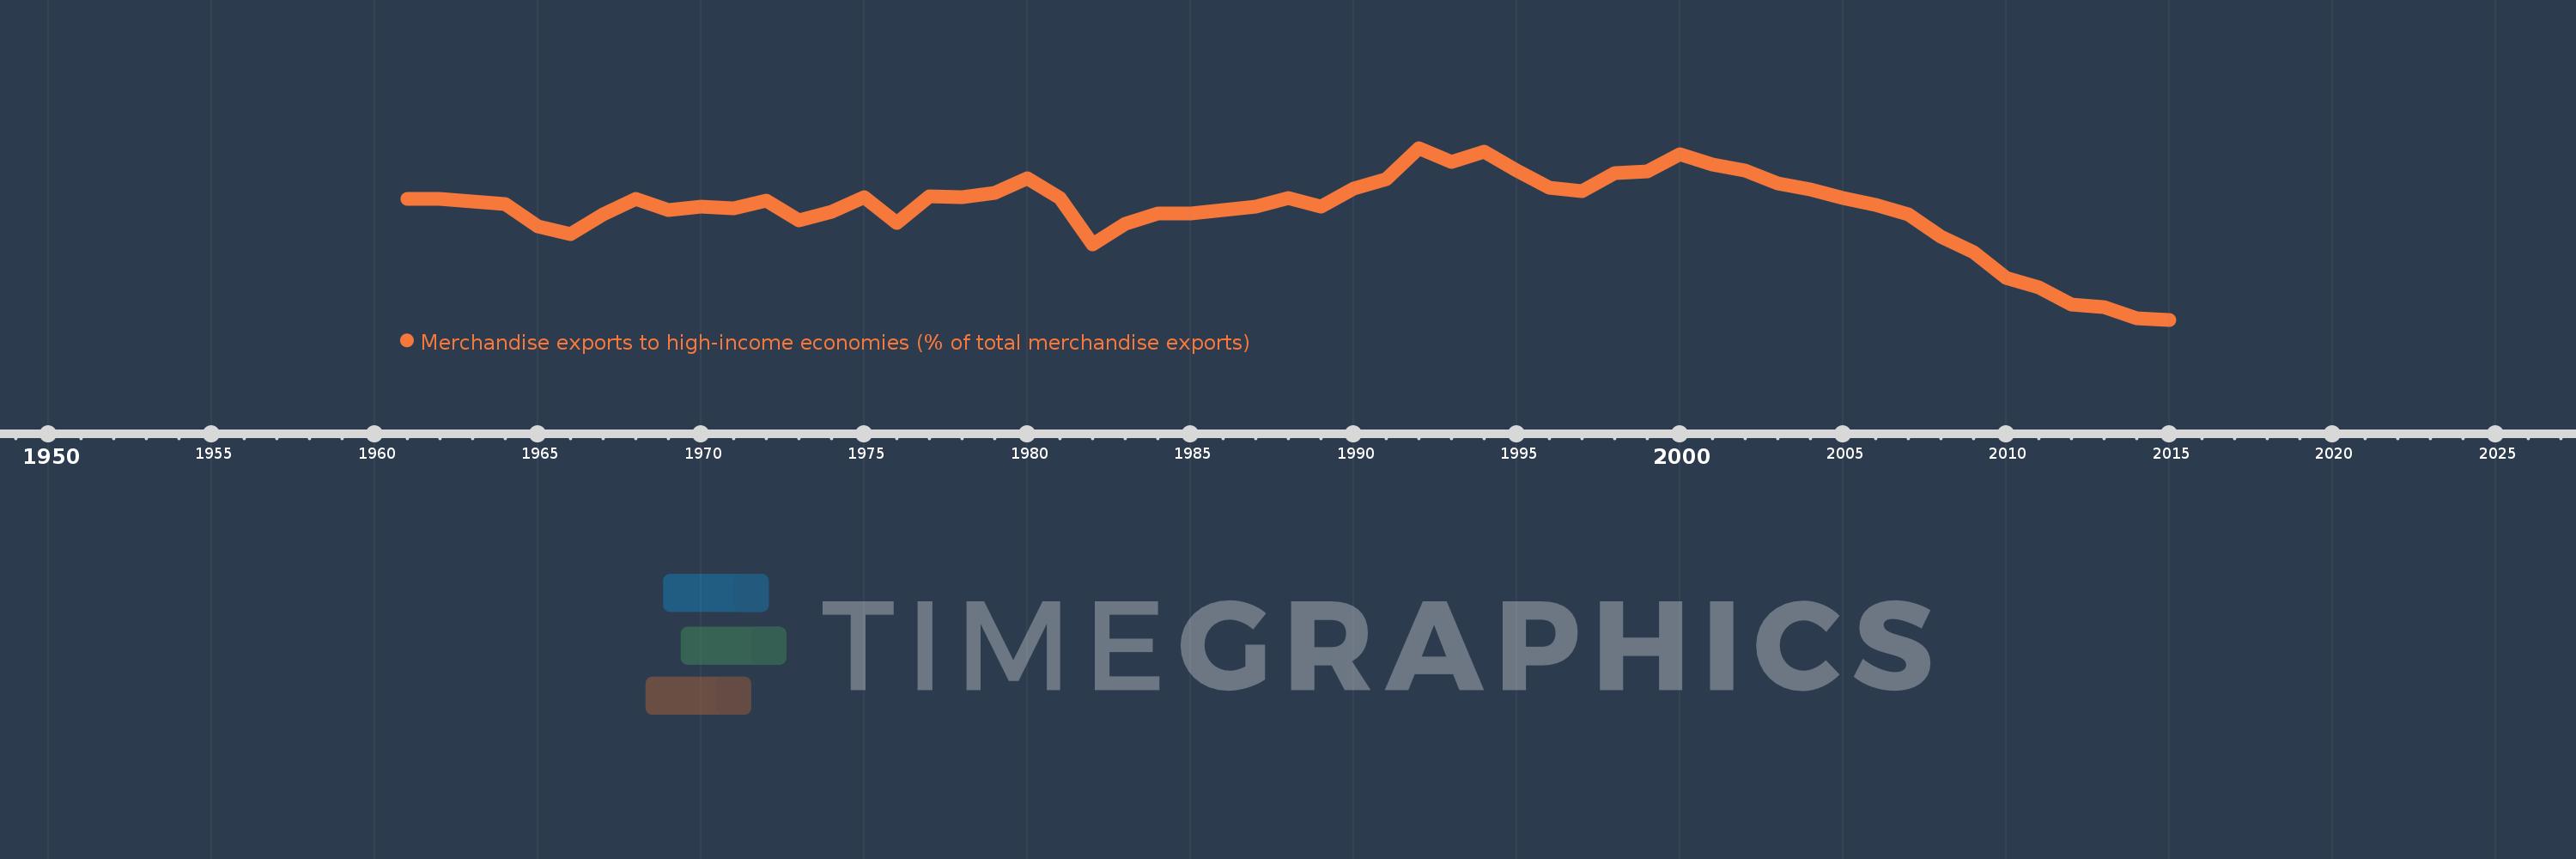
Merchandise exports to high-income economies (% of total merchandise exports)
2015,2014,2013,2012,2011,2010,2009,2008,2007,2006,2005,2004,2003,2002,2001,2000,1999,1998,1997,1996,1995,1994,1993,1992,1991,1990,1989,1988,1987,1986,1985,1984,1983,1982,1981,1980,1979,1978,1977,1976,1975,1974,1973,1972,1971,1970,1969,1968,1967,1966,1965,1964,1963,1962,1961
This statistics in other country:
AfghanistanAlbaniaAlgeriaAmerican SamoaAngolaAntigua and BarbudaArab WorldArgentinaArmeniaArubaAustraliaAustriaAzerbaijanBahamas, TheBahrainBangladeshBarbadosBelarusBelgiumBelizeBeninBermudaBoliviaBosnia and HerzegovinaBrazilBrunei DarussalamBulgariaBurkina FasoBurundiCabo VerdeCambodiaCameroonCanadaCaribbean small statesCentral African RepublicCentral Europe and the BalticsChadChileChinaColombiaComorosCongo, Dem. Rep.Congo, Rep.Costa RicaCote d'IvoireCroatiaCubaCyprusCzech RepublicDenmarkDjiboutiDominicaDominican RepublicEarly-demographic dividendEast Asia & PacificEast Asia & Pacific (excluding high income)East Asia & Pacific (IDA & IBRD countries)EcuadorEgypt, Arab Rep.El SalvadorEquatorial GuineaEstoniaEthiopiaEuro areaEurope & Central AsiaEurope & Central Asia (excluding high income)Europe & Central Asia (IDA & IBRD countries)European UnionFaroe IslandsFijiFinlandFragile and conflict affected situationsFranceFrench PolynesiaGabonGambia, TheGeorgiaGermanyGhanaGibraltarGreeceGreenlandGrenadaGuamGuatemalaGuineaGuinea-BissauGuyanaHaitiHeavily indebted poor countries (HIPC)High incomeHondurasHong Kong SAR, ChinaHungaryIBRD onlyIcelandIDA & IBRD totalIDA blendIDA onlyIDA totalIndiaIndonesiaIran, Islamic Rep.IraqIrelandIsraelItalyJamaicaJapanJordanKazakhstanKenyaKiribatiKorea, Dem. People’s Rep.Korea, Rep.KosovoKuwaitKyrgyz RepublicLao PDRLate-demographic dividendLatin America & Caribbean Latin America & Caribbean (excluding high income)Latin America & the Caribbean (IDA & IBRD countries)LatviaLeast developed countries: UN classificationLebanonLiberiaLibyaLithuaniaLow & middle incomeLow incomeLower middle incomeLuxembourgMacao SAR, ChinaMacedonia, FYRMadagascarMalawiMalaysiaMaldivesMaliMaltaMauritaniaMauritiusMexicoMiddle East & North AfricaMiddle East & North Africa (excluding high income)Middle East & North Africa (IDA & IBRD countries)Middle incomeMoldovaMongoliaMontenegroMoroccoMozambiqueMyanmarNauruNepalNetherlandsNew CaledoniaNew ZealandNicaraguaNigerNigeriaNorth AmericaNorwayOECD membersOmanOther small statesPacific island small statesPakistanPanamaPapua New GuineaParaguayPeruPhilippinesPolandPortugalPost-demographic dividendPre-demographic dividendQatarRomaniaRussian FederationRwandaSamoaSao Tome and PrincipeSaudi ArabiaSenegalSerbiaSeychellesSierra LeoneSingaporeSlovak RepublicSloveniaSmall statesSolomon IslandsSomaliaSouth AfricaSouth AsiaSouth Asia (IDA & IBRD)SpainSri LankaSt. Kitts and NevisSt. LuciaSt. Vincent and the GrenadinesSub-Saharan Africa Sub-Saharan Africa (excluding high income)Sub-Saharan Africa (IDA & IBRD countries)SudanSurinameSwedenSwitzerlandSyrian Arab RepublicTajikistanTanzaniaThailandTogoTongaTrinidad and TobagoTunisiaTurkeyTurkmenistanTuvaluUgandaUkraineUnited Arab EmiratesUnited KingdomUnited StatesUpper middle incomeUruguayUzbekistanVanuatuVenezuela, RBVietnamWorldYemen, Rep.ZambiaZimbabwe Timeline:
This timeline shows a graph from 1961 to 2015 of Low & middle income. No data until 1960. Number of actual observations by date: 55.
Source name:
World Development Indicators
Source organization:
World Bank staff estimates based data from International Monetary Fund's Direction of Trade database.
Categories, topics:
Private Sector, Trade
Last updated:
apr 23, 2017
Indicators value changes by year
Minimum:
66.079
jan 1, 2015
Maximum:
81.057
jan 1, 1992
At the date of observation
Value
Absolute change
Change from previous value
jan 1, 1961
76.637
+76.637
0.0%
jan 1, 1962
76.618
-0.019
-0.02%
jan 1, 1963
76.361
-0.257
-0.34%
jan 1, 1964
76.163
-0.198
-0.26%
jan 1, 1965
74.241
-1.922
-2.52%
jan 1, 1966
73.57
-0.671
-0.9%
jan 1, 1967
75.275
+1.706
2.32%
jan 1, 1968
76.606
+1.331
1.77%
jan 1, 1969
75.616
-0.99
-1.29%
jan 1, 1970
75.965
+0.349
0.46%
jan 1, 1971
75.827
-0.137
-0.18%
jan 1, 1972
76.435
+0.608
0.8%
jan 1, 1973
74.754
-1.682
-2.2%
jan 1, 1974
75.488
+0.734
0.98%
jan 1, 1975
76.732
+1.244
1.65%
jan 1, 1976
74.529
-2.203
-2.87%
jan 1, 1977
76.807
+2.278
3.06%
jan 1, 1978
76.733
-0.074
-0.1%
jan 1, 1979
77.123
+0.39
0.51%
jan 1, 1980
78.41
+1.287
1.67%
jan 1, 1981
76.722
-1.688
-2.15%
jan 1, 1982
72.619
-4.103
-5.35%
jan 1, 1983
74.441
+1.822
2.51%
jan 1, 1984
75.364
+0.922
1.24%
jan 1, 1985
75.34
-0.024
-0.03%
jan 1, 1986
75.606
+0.266
0.35%
jan 1, 1987
75.932
+0.326
0.43%
jan 1, 1988
76.656
+0.725
0.95%
jan 1, 1989
75.913
-0.743
-0.97%
jan 1, 1990
77.532
+1.619
2.13%
jan 1, 1991
78.305
+0.773
1.0%
jan 1, 1992
81.057
+2.752
3.51%
jan 1, 1993
79.873
-1.183
-1.46%
jan 1, 1994
80.742
+0.869
1.09%
jan 1, 1995
79.114
-1.628
-2.02%
jan 1, 1996
77.585
-1.529
-1.93%
jan 1, 1997
77.307
-0.278
-0.36%
jan 1, 1998
78.861
+1.554
2.01%
jan 1, 1999
78.985
+0.124
0.16%
jan 1, 2000
80.494
+1.509
1.91%
jan 1, 2001
79.63
-0.863
-1.07%
jan 1, 2002
79.093
-0.537
-0.67%
jan 1, 2003
77.953
-1.14
-1.44%
jan 1, 2004
77.415
-0.539
-0.69%
jan 1, 2005
76.694
-0.721
-0.93%
jan 1, 2006
76.127
-0.567
-0.74%
jan 1, 2007
75.28
-0.847
-1.11%
jan 1, 2008
73.336
-1.943
-2.58%
jan 1, 2009
71.972
-1.364
-1.86%
jan 1, 2010
69.715
-2.258
-3.14%
jan 1, 2011
68.904
-0.811
-1.16%
jan 1, 2012
67.395
-1.508
-2.19%
jan 1, 2013
67.145
-0.25
-0.37%
jan 1, 2014
66.188
-0.957
-1.43%
jan 1, 2015
66.079
-0.109
-0.17%
Ranking of countries by current statistics by years


Comments: