29
/
en
AIzaSyAYiBZKx7MnpbEhh9jyipgxe19OcubqV5w
April 1, 2024
61816
Upper middle income
UMC
false
2
1
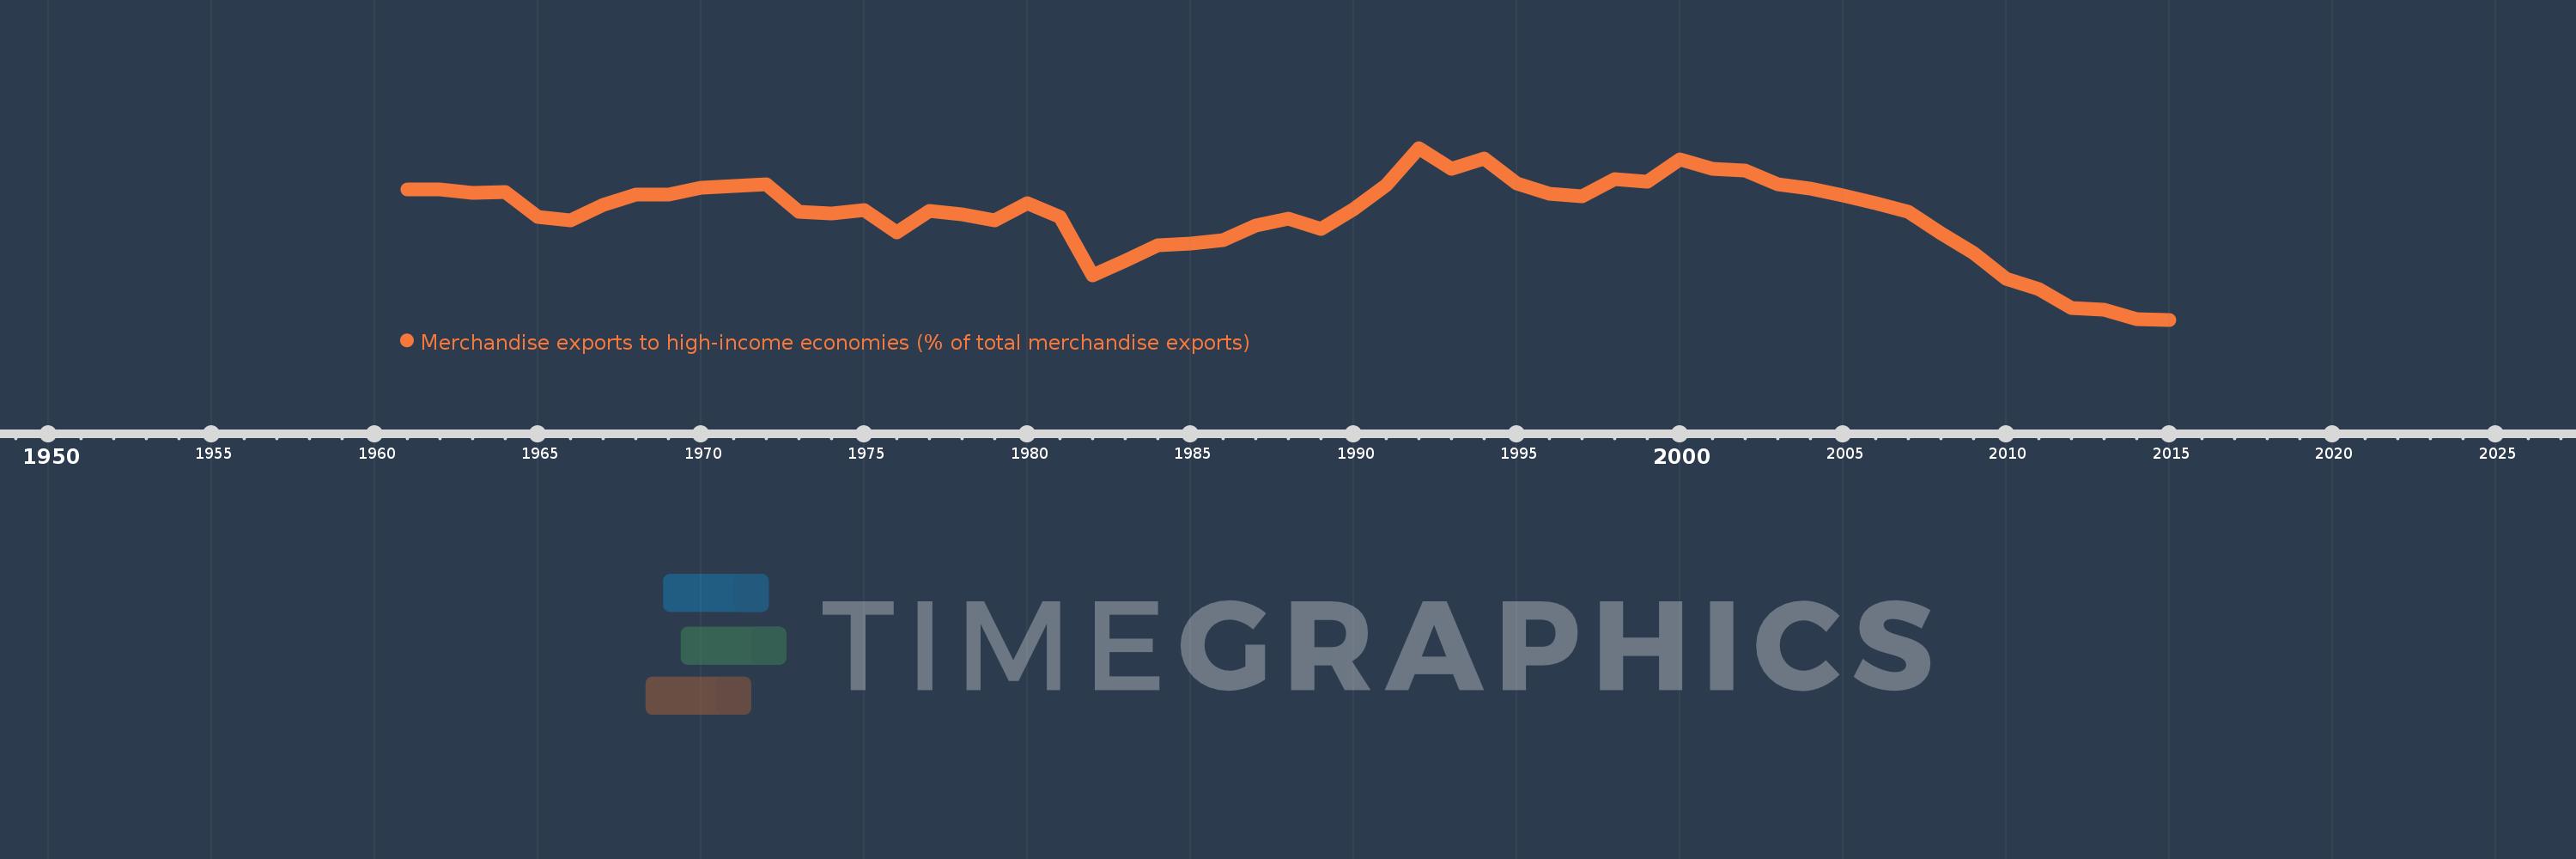
Merchandise exports to high-income economies (% of total merchandise exports)
2015,2014,2013,2012,2011,2010,2009,2008,2007,2006,2005,2004,2003,2002,2001,2000,1999,1998,1997,1996,1995,1994,1993,1992,1991,1990,1989,1988,1987,1986,1985,1984,1983,1982,1981,1980,1979,1978,1977,1976,1975,1974,1973,1972,1971,1970,1969,1968,1967,1966,1965,1964,1963,1962,1961
This statistics in other country:
AfghanistanAlbaniaAlgeriaAmerican SamoaAngolaAntigua and BarbudaArab WorldArgentinaArmeniaArubaAustraliaAustriaAzerbaijanBahamas, TheBahrainBangladeshBarbadosBelarusBelgiumBelizeBeninBermudaBoliviaBosnia and HerzegovinaBrazilBrunei DarussalamBulgariaBurkina FasoBurundiCabo VerdeCambodiaCameroonCanadaCaribbean small statesCentral African RepublicCentral Europe and the BalticsChadChileChinaColombiaComorosCongo, Dem. Rep.Congo, Rep.Costa RicaCote d'IvoireCroatiaCubaCyprusCzech RepublicDenmarkDjiboutiDominicaDominican RepublicEarly-demographic dividendEast Asia & PacificEast Asia & Pacific (excluding high income)East Asia & Pacific (IDA & IBRD countries)EcuadorEgypt, Arab Rep.El SalvadorEquatorial GuineaEstoniaEthiopiaEuro areaEurope & Central AsiaEurope & Central Asia (excluding high income)Europe & Central Asia (IDA & IBRD countries)European UnionFaroe IslandsFijiFinlandFragile and conflict affected situationsFranceFrench PolynesiaGabonGambia, TheGeorgiaGermanyGhanaGibraltarGreeceGreenlandGrenadaGuamGuatemalaGuineaGuinea-BissauGuyanaHaitiHeavily indebted poor countries (HIPC)High incomeHondurasHong Kong SAR, ChinaHungaryIBRD onlyIcelandIDA & IBRD totalIDA blendIDA onlyIDA totalIndiaIndonesiaIran, Islamic Rep.IraqIrelandIsraelItalyJamaicaJapanJordanKazakhstanKenyaKiribatiKorea, Dem. People’s Rep.Korea, Rep.KosovoKuwaitKyrgyz RepublicLao PDRLate-demographic dividendLatin America & Caribbean Latin America & Caribbean (excluding high income)Latin America & the Caribbean (IDA & IBRD countries)LatviaLeast developed countries: UN classificationLebanonLiberiaLibyaLithuaniaLow & middle incomeLow incomeLower middle incomeLuxembourgMacao SAR, ChinaMacedonia, FYRMadagascarMalawiMalaysiaMaldivesMaliMaltaMauritaniaMauritiusMexicoMiddle East & North AfricaMiddle East & North Africa (excluding high income)Middle East & North Africa (IDA & IBRD countries)Middle incomeMoldovaMongoliaMontenegroMoroccoMozambiqueMyanmarNauruNepalNetherlandsNew CaledoniaNew ZealandNicaraguaNigerNigeriaNorth AmericaNorwayOECD membersOmanOther small statesPacific island small statesPakistanPanamaPapua New GuineaParaguayPeruPhilippinesPolandPortugalPost-demographic dividendPre-demographic dividendQatarRomaniaRussian FederationRwandaSamoaSao Tome and PrincipeSaudi ArabiaSenegalSerbiaSeychellesSierra LeoneSingaporeSlovak RepublicSloveniaSmall statesSolomon IslandsSomaliaSouth AfricaSouth AsiaSouth Asia (IDA & IBRD)SpainSri LankaSt. Kitts and NevisSt. LuciaSt. Vincent and the GrenadinesSub-Saharan Africa Sub-Saharan Africa (excluding high income)Sub-Saharan Africa (IDA & IBRD countries)SudanSurinameSwedenSwitzerlandSyrian Arab RepublicTajikistanTanzaniaThailandTogoTongaTrinidad and TobagoTunisiaTurkeyTurkmenistanTuvaluUgandaUkraineUnited Arab EmiratesUnited KingdomUnited StatesUpper middle incomeUruguayUzbekistanVanuatuVenezuela, RBVietnamWorldYemen, Rep.ZambiaZimbabwe Timeline:
This timeline shows a graph from 1961 to 2015 of Upper middle income. No data until 1960. Number of actual observations by date: 55.
Source name:
World Development Indicators
Source organization:
World Bank staff estimates based data from International Monetary Fund's Direction of Trade database.
Categories, topics:
Private Sector, Trade
Last updated:
apr 23, 2017
Indicators value changes by year
Minimum:
67.678
jan 1, 2015
Maximum:
82.588
jan 1, 1992
At the date of observation
Value
Absolute change
Change from previous value
jan 1, 1961
79.003
+79.003
0.0%
jan 1, 1962
78.953
-0.05
-0.06%
jan 1, 1963
78.653
-0.299
-0.38%
jan 1, 1964
78.745
+0.092
0.12%
jan 1, 1965
76.589
-2.156
-2.74%
jan 1, 1966
76.299
-0.29
-0.38%
jan 1, 1967
77.634
+1.335
1.75%
jan 1, 1968
78.57
+0.936
1.21%
jan 1, 1969
78.525
-0.045
-0.06%
jan 1, 1970
79.159
+0.633
0.81%
jan 1, 1971
79.286
+0.127
0.16%
jan 1, 1972
79.466
+0.18
0.23%
jan 1, 1973
77.063
-2.403
-3.02%
jan 1, 1974
76.882
-0.181
-0.23%
jan 1, 1975
77.184
+0.301
0.39%
jan 1, 1976
75.229
-1.955
-2.53%
jan 1, 1977
77.141
+1.912
2.54%
jan 1, 1978
76.807
-0.335
-0.43%
jan 1, 1979
76.299
-0.507
-0.66%
jan 1, 1980
77.802
+1.503
1.97%
jan 1, 1981
76.572
-1.23
-1.58%
jan 1, 1982
71.513
-5.059
-6.61%
jan 1, 1983
72.836
+1.323
1.85%
jan 1, 1984
74.17
+1.333
1.83%
jan 1, 1985
74.295
+0.126
0.17%
jan 1, 1986
74.623
+0.328
0.44%
jan 1, 1987
75.876
+1.253
1.68%
jan 1, 1988
76.453
+0.577
0.76%
jan 1, 1989
75.539
-0.914
-1.2%
jan 1, 1990
77.306
+1.767
2.34%
jan 1, 1991
79.354
+2.048
2.65%
jan 1, 1992
82.588
+3.234
4.08%
jan 1, 1993
80.772
-1.817
-2.2%
jan 1, 1994
81.677
+0.906
1.12%
jan 1, 1995
79.506
-2.171
-2.66%
jan 1, 1996
78.595
-0.911
-1.15%
jan 1, 1997
78.396
-0.198
-0.25%
jan 1, 1998
79.898
+1.501
1.92%
jan 1, 1999
79.625
-0.273
-0.34%
jan 1, 2000
81.619
+1.994
2.5%
jan 1, 2001
80.783
-0.836
-1.02%
jan 1, 2002
80.632
-0.151
-0.19%
jan 1, 2003
79.44
-1.192
-1.48%
jan 1, 2004
79.091
-0.349
-0.44%
jan 1, 2005
78.44
-0.651
-0.82%
jan 1, 2006
77.8
-0.64
-0.82%
jan 1, 2007
77.036
-0.764
-0.98%
jan 1, 2008
75.163
-1.873
-2.43%
jan 1, 2009
73.482
-1.681
-2.24%
jan 1, 2010
71.214
-2.267
-3.09%
jan 1, 2011
70.333
-0.881
-1.24%
jan 1, 2012
68.665
-1.668
-2.37%
jan 1, 2013
68.54
-0.126
-0.18%
jan 1, 2014
67.758
-0.782
-1.14%
jan 1, 2015
67.678
-0.08
-0.12%
Ranking of countries by current statistics by years


Comments: