29
/
en
AIzaSyAYiBZKx7MnpbEhh9jyipgxe19OcubqV5w
April 1, 2024
29270
East Asia & Pacific (IDA & IBRD countries)
TEA
false
2
1
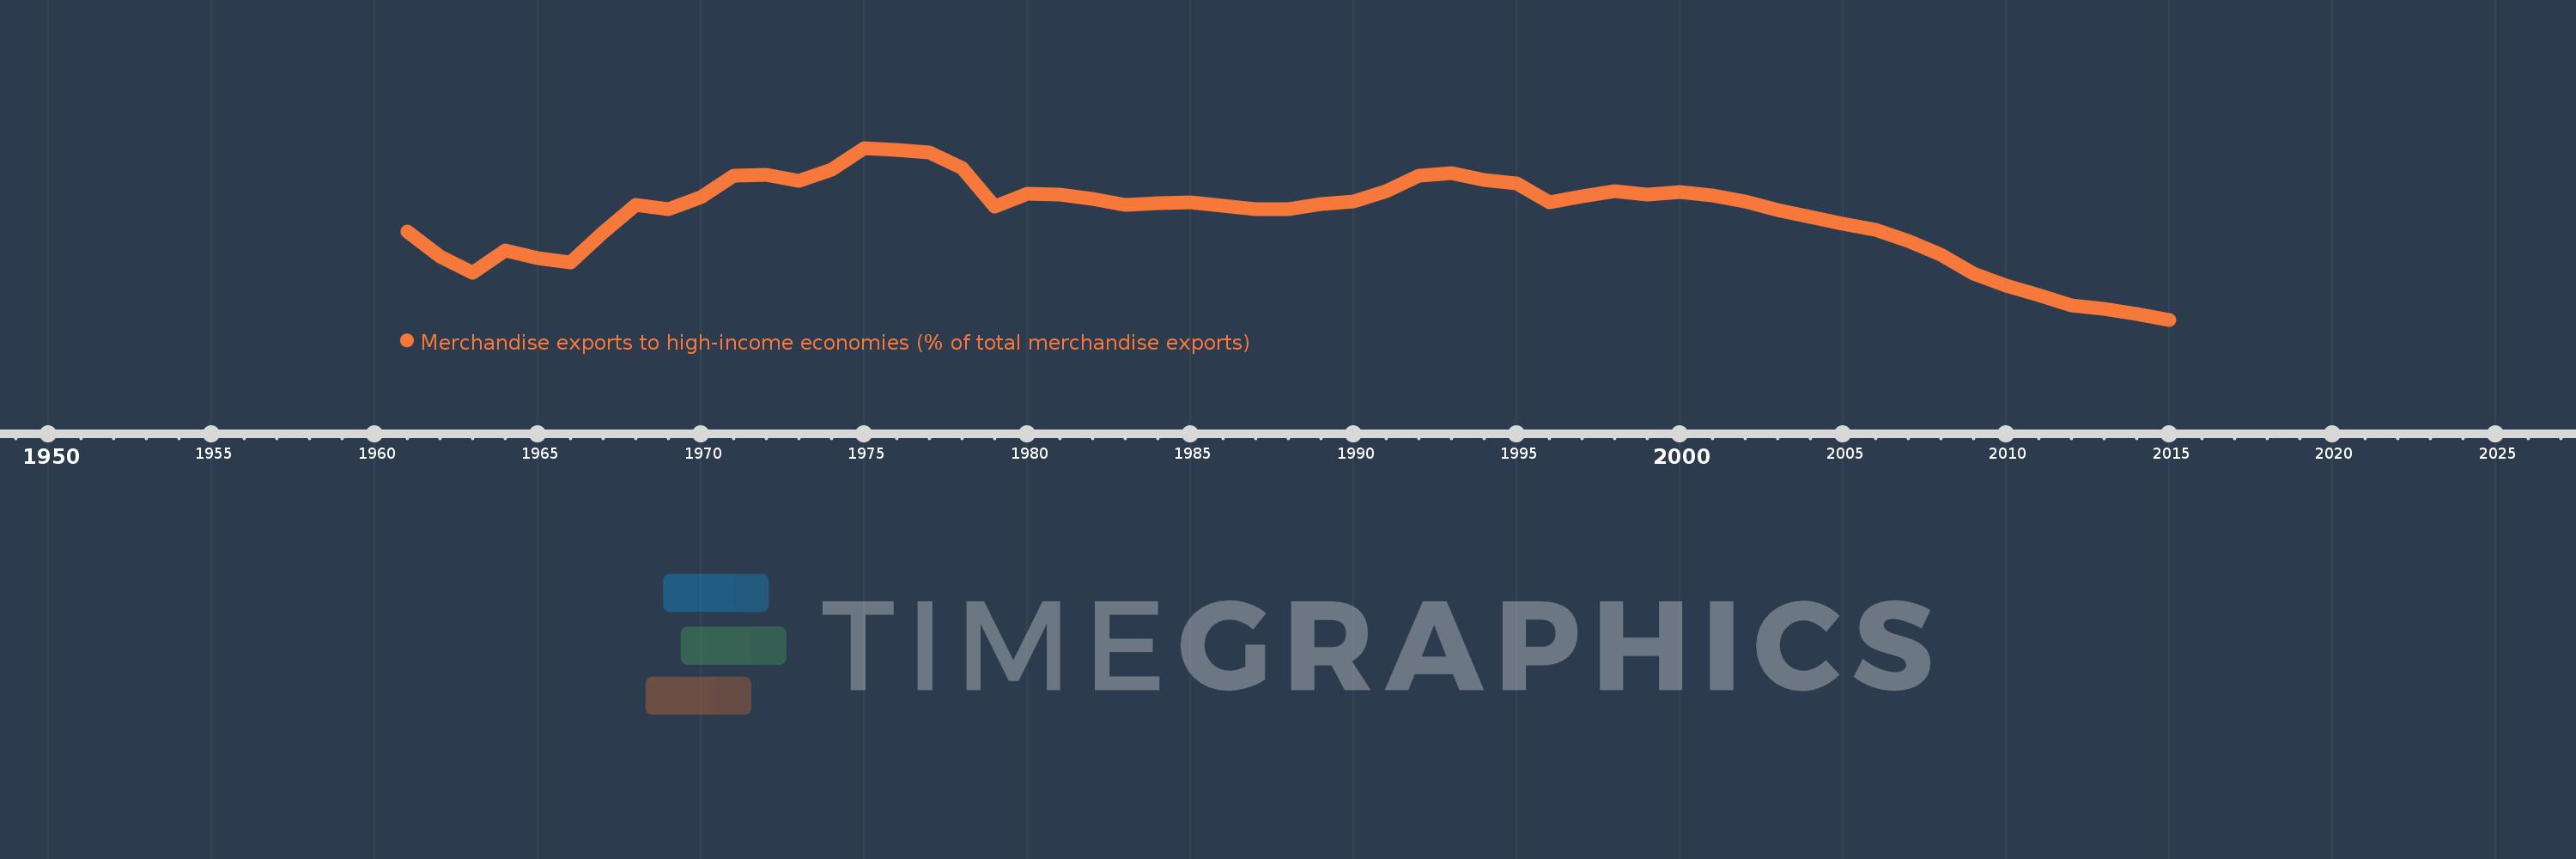
Merchandise exports to high-income economies (% of total merchandise exports)
2015,2014,2013,2012,2011,2010,2009,2008,2007,2006,2005,2004,2003,2002,2001,2000,1999,1998,1997,1996,1995,1994,1993,1992,1991,1990,1989,1988,1987,1986,1985,1984,1983,1982,1981,1980,1979,1978,1977,1976,1975,1974,1973,1972,1971,1970,1969,1968,1967,1966,1965,1964,1963,1962,1961
This statistics in other country:
AfghanistanAlbaniaAlgeriaAmerican SamoaAngolaAntigua and BarbudaArab WorldArgentinaArmeniaArubaAustraliaAustriaAzerbaijanBahamas, TheBahrainBangladeshBarbadosBelarusBelgiumBelizeBeninBermudaBoliviaBosnia and HerzegovinaBrazilBrunei DarussalamBulgariaBurkina FasoBurundiCabo VerdeCambodiaCameroonCanadaCaribbean small statesCentral African RepublicCentral Europe and the BalticsChadChileChinaColombiaComorosCongo, Dem. Rep.Congo, Rep.Costa RicaCote d'IvoireCroatiaCubaCyprusCzech RepublicDenmarkDjiboutiDominicaDominican RepublicEarly-demographic dividendEast Asia & PacificEast Asia & Pacific (excluding high income)East Asia & Pacific (IDA & IBRD countries)EcuadorEgypt, Arab Rep.El SalvadorEquatorial GuineaEstoniaEthiopiaEuro areaEurope & Central AsiaEurope & Central Asia (excluding high income)Europe & Central Asia (IDA & IBRD countries)European UnionFaroe IslandsFijiFinlandFragile and conflict affected situationsFranceFrench PolynesiaGabonGambia, TheGeorgiaGermanyGhanaGibraltarGreeceGreenlandGrenadaGuamGuatemalaGuineaGuinea-BissauGuyanaHaitiHeavily indebted poor countries (HIPC)High incomeHondurasHong Kong SAR, ChinaHungaryIBRD onlyIcelandIDA & IBRD totalIDA blendIDA onlyIDA totalIndiaIndonesiaIran, Islamic Rep.IraqIrelandIsraelItalyJamaicaJapanJordanKazakhstanKenyaKiribatiKorea, Dem. People’s Rep.Korea, Rep.KosovoKuwaitKyrgyz RepublicLao PDRLate-demographic dividendLatin America & Caribbean Latin America & Caribbean (excluding high income)Latin America & the Caribbean (IDA & IBRD countries)LatviaLeast developed countries: UN classificationLebanonLiberiaLibyaLithuaniaLow & middle incomeLow incomeLower middle incomeLuxembourgMacao SAR, ChinaMacedonia, FYRMadagascarMalawiMalaysiaMaldivesMaliMaltaMauritaniaMauritiusMexicoMiddle East & North AfricaMiddle East & North Africa (excluding high income)Middle East & North Africa (IDA & IBRD countries)Middle incomeMoldovaMongoliaMontenegroMoroccoMozambiqueMyanmarNauruNepalNetherlandsNew CaledoniaNew ZealandNicaraguaNigerNigeriaNorth AmericaNorwayOECD membersOmanOther small statesPacific island small statesPakistanPanamaPapua New GuineaParaguayPeruPhilippinesPolandPortugalPost-demographic dividendPre-demographic dividendQatarRomaniaRussian FederationRwandaSamoaSao Tome and PrincipeSaudi ArabiaSenegalSerbiaSeychellesSierra LeoneSingaporeSlovak RepublicSloveniaSmall statesSolomon IslandsSomaliaSouth AfricaSouth AsiaSouth Asia (IDA & IBRD)SpainSri LankaSt. Kitts and NevisSt. LuciaSt. Vincent and the GrenadinesSub-Saharan Africa Sub-Saharan Africa (excluding high income)Sub-Saharan Africa (IDA & IBRD countries)SudanSurinameSwedenSwitzerlandSyrian Arab RepublicTajikistanTanzaniaThailandTogoTongaTrinidad and TobagoTunisiaTurkeyTurkmenistanTuvaluUgandaUkraineUnited Arab EmiratesUnited KingdomUnited StatesUpper middle incomeUruguayUzbekistanVanuatuVenezuela, RBVietnamWorldYemen, Rep.ZambiaZimbabwe Timeline:
This timeline shows a graph from 1961 to 2015 of East Asia & Pacific (IDA & IBRD countries). No data until 1960. Number of actual observations by date: 55.
Source name:
World Development Indicators
Source organization:
World Bank staff estimates based data from International Monetary Fund's Direction of Trade database.
Categories, topics:
Private Sector, Trade
Last updated:
apr 23, 2017
Indicators value changes by year
Maximum:
89.885
jan 1, 1975
At the date of observation
Value
Absolute change
Change from previous value
jan 1, 1961
80.228
+80.228
0.0%
jan 1, 1962
77.298
-2.929
-3.65%
jan 1, 1963
75.404
-1.894
-2.45%
jan 1, 1964
77.983
+2.579
3.42%
jan 1, 1965
77.149
-0.834
-1.07%
jan 1, 1966
76.608
-0.542
-0.7%
jan 1, 1967
80.08
+3.472
4.53%
jan 1, 1968
83.315
+3.235
4.04%
jan 1, 1969
82.774
-0.541
-0.65%
jan 1, 1970
84.169
+1.396
1.69%
jan 1, 1971
86.687
+2.517
2.99%
jan 1, 1972
86.759
+0.073
0.08%
jan 1, 1973
86.047
-0.713
-0.82%
jan 1, 1974
87.336
+1.29
1.5%
jan 1, 1975
89.885
+2.549
2.92%
jan 1, 1976
89.619
-0.266
-0.3%
jan 1, 1977
89.386
-0.232
-0.26%
jan 1, 1978
87.604
-1.782
-1.99%
jan 1, 1979
83.14
-4.464
-5.1%
jan 1, 1980
84.627
+1.487
1.79%
jan 1, 1981
84.48
-0.147
-0.17%
jan 1, 1982
83.993
-0.487
-0.58%
jan 1, 1983
83.259
-0.734
-0.87%
jan 1, 1984
83.462
+0.202
0.24%
jan 1, 1985
83.63
+0.168
0.2%
jan 1, 1986
83.162
-0.468
-0.56%
jan 1, 1987
82.82
-0.342
-0.41%
jan 1, 1988
82.803
-0.017
-0.02%
jan 1, 1989
83.367
+0.564
0.68%
jan 1, 1990
83.653
+0.286
0.34%
jan 1, 1991
84.883
+1.231
1.47%
jan 1, 1992
86.713
+1.829
2.16%
jan 1, 1993
87.01
+0.297
0.34%
jan 1, 1994
86.209
-0.801
-0.92%
jan 1, 1995
85.825
-0.384
-0.45%
jan 1, 1996
83.567
-2.257
-2.63%
jan 1, 1997
84.32
+0.753
0.9%
jan 1, 1998
84.918
+0.598
0.71%
jan 1, 1999
84.497
-0.421
-0.5%
jan 1, 2000
84.825
+0.328
0.39%
jan 1, 2001
84.376
-0.449
-0.53%
jan 1, 2002
83.71
-0.666
-0.79%
jan 1, 2003
82.685
-1.026
-1.23%
jan 1, 2004
81.891
-0.794
-0.96%
jan 1, 2005
81.149
-0.741
-0.91%
jan 1, 2006
80.429
-0.72
-0.89%
jan 1, 2007
79.083
-1.346
-1.67%
jan 1, 2008
77.564
-1.52
-1.92%
jan 1, 2009
75.365
-2.199
-2.84%
jan 1, 2010
73.934
-1.43
-1.9%
jan 1, 2011
72.901
-1.033
-1.4%
jan 1, 2012
71.62
-1.281
-1.76%
jan 1, 2013
71.28
-0.34
-0.47%
jan 1, 2014
70.708
-0.572
-0.8%
jan 1, 2015
70.0
-0.708
-1.0%
Ranking of countries by current statistics by years


Comments: