29
/
en
AIzaSyAYiBZKx7MnpbEhh9jyipgxe19OcubqV5w
April 1, 2024
201854
Morocco
MAR
true
2
1
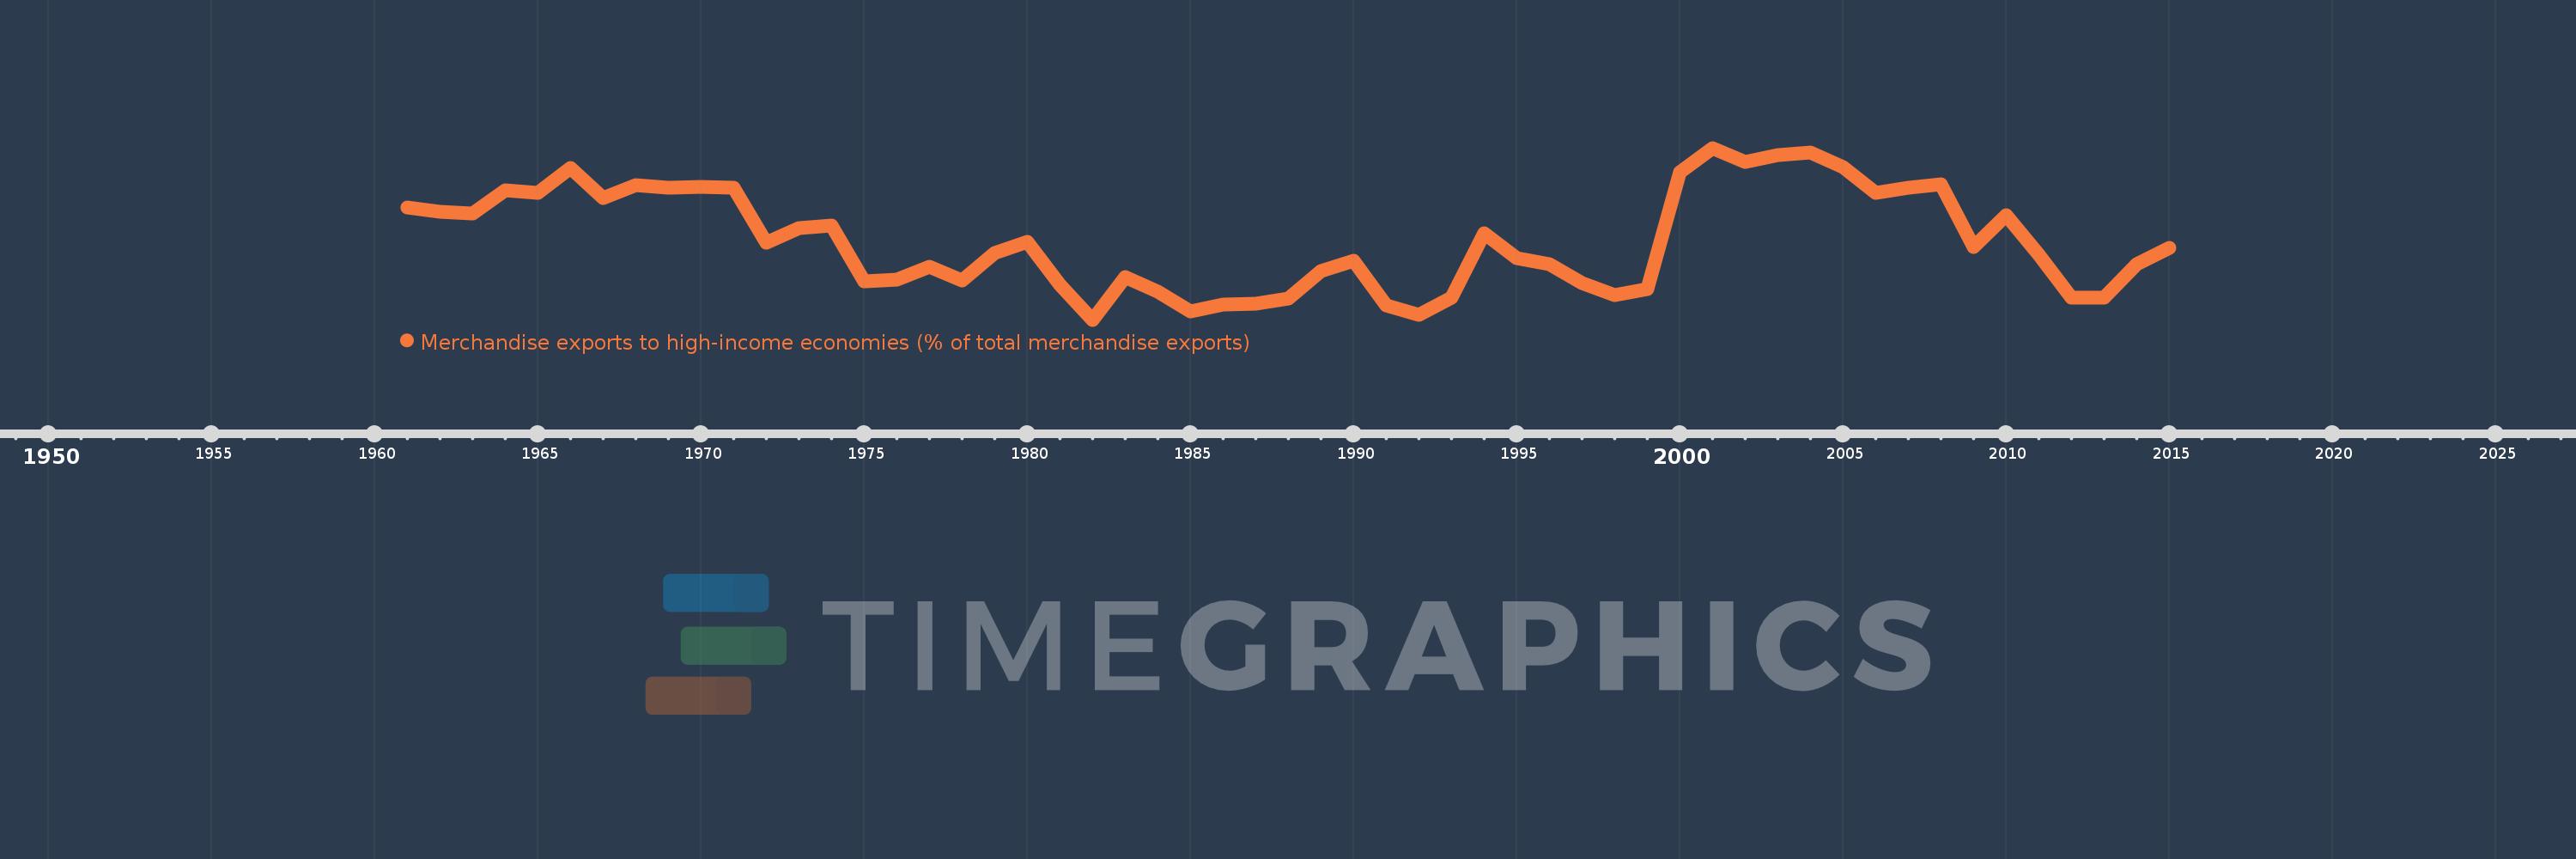
Merchandise exports to high-income economies (% of total merchandise exports)
2015,2014,2013,2012,2011,2010,2009,2008,2007,2006,2005,2004,2003,2002,2001,2000,1999,1998,1997,1996,1995,1994,1993,1992,1991,1990,1989,1988,1987,1986,1985,1984,1983,1982,1981,1980,1979,1978,1977,1976,1975,1974,1973,1972,1971,1970,1969,1968,1967,1966,1965,1964,1963,1962,1961
This statistics in other country:
AfghanistanAlbaniaAlgeriaAmerican SamoaAngolaAntigua and BarbudaArab WorldArgentinaArmeniaArubaAustraliaAustriaAzerbaijanBahamas, TheBahrainBangladeshBarbadosBelarusBelgiumBelizeBeninBermudaBoliviaBosnia and HerzegovinaBrazilBrunei DarussalamBulgariaBurkina FasoBurundiCabo VerdeCambodiaCameroonCanadaCaribbean small statesCentral African RepublicCentral Europe and the BalticsChadChileChinaColombiaComorosCongo, Dem. Rep.Congo, Rep.Costa RicaCote d'IvoireCroatiaCubaCyprusCzech RepublicDenmarkDjiboutiDominicaDominican RepublicEarly-demographic dividendEast Asia & PacificEast Asia & Pacific (excluding high income)East Asia & Pacific (IDA & IBRD countries)EcuadorEgypt, Arab Rep.El SalvadorEquatorial GuineaEstoniaEthiopiaEuro areaEurope & Central AsiaEurope & Central Asia (excluding high income)Europe & Central Asia (IDA & IBRD countries)European UnionFaroe IslandsFijiFinlandFragile and conflict affected situationsFranceFrench PolynesiaGabonGambia, TheGeorgiaGermanyGhanaGibraltarGreeceGreenlandGrenadaGuamGuatemalaGuineaGuinea-BissauGuyanaHaitiHeavily indebted poor countries (HIPC)High incomeHondurasHong Kong SAR, ChinaHungaryIBRD onlyIcelandIDA & IBRD totalIDA blendIDA onlyIDA totalIndiaIndonesiaIran, Islamic Rep.IraqIrelandIsraelItalyJamaicaJapanJordanKazakhstanKenyaKiribatiKorea, Dem. People’s Rep.Korea, Rep.KosovoKuwaitKyrgyz RepublicLao PDRLate-demographic dividendLatin America & Caribbean Latin America & Caribbean (excluding high income)Latin America & the Caribbean (IDA & IBRD countries)LatviaLeast developed countries: UN classificationLebanonLiberiaLibyaLithuaniaLow & middle incomeLow incomeLower middle incomeLuxembourgMacao SAR, ChinaMacedonia, FYRMadagascarMalawiMalaysiaMaldivesMaliMaltaMauritaniaMauritiusMexicoMiddle East & North AfricaMiddle East & North Africa (excluding high income)Middle East & North Africa (IDA & IBRD countries)Middle incomeMoldovaMongoliaMontenegroMoroccoMozambiqueMyanmarNauruNepalNetherlandsNew CaledoniaNew ZealandNicaraguaNigerNigeriaNorth AmericaNorwayOECD membersOmanOther small statesPacific island small statesPakistanPanamaPapua New GuineaParaguayPeruPhilippinesPolandPortugalPost-demographic dividendPre-demographic dividendQatarRomaniaRussian FederationRwandaSamoaSao Tome and PrincipeSaudi ArabiaSenegalSerbiaSeychellesSierra LeoneSingaporeSlovak RepublicSloveniaSmall statesSolomon IslandsSomaliaSouth AfricaSouth AsiaSouth Asia (IDA & IBRD)SpainSri LankaSt. Kitts and NevisSt. LuciaSt. Vincent and the GrenadinesSub-Saharan Africa Sub-Saharan Africa (excluding high income)Sub-Saharan Africa (IDA & IBRD countries)SudanSurinameSwedenSwitzerlandSyrian Arab RepublicTajikistanTanzaniaThailandTogoTongaTrinidad and TobagoTunisiaTurkeyTurkmenistanTuvaluUgandaUkraineUnited Arab EmiratesUnited KingdomUnited StatesUpper middle incomeUruguayUzbekistanVanuatuVenezuela, RBVietnamWorldYemen, Rep.ZambiaZimbabwe Timeline:
This timeline shows a graph from 1961 to 2015 of Morocco. No data until 1960. Number of actual observations by date: 55.
Source name:
World Development Indicators
Source organization:
World Bank staff estimates based data from International Monetary Fund's Direction of Trade database.
Categories, topics:
Private Sector, Trade
Last updated:
apr 23, 2017
Indicators value changes by year
Minimum:
65.622
jan 1, 1982
At the date of observation
Value
Absolute change
Change from previous value
jan 1, 1961
77.639
+77.639
0.0%
jan 1, 1962
77.245
-0.394
-0.51%
jan 1, 1963
77.006
-0.239
-0.31%
jan 1, 1964
79.501
+2.496
3.24%
jan 1, 1965
79.265
-0.236
-0.3%
jan 1, 1966
81.92
+2.654
3.35%
jan 1, 1967
78.733
-3.187
-3.89%
jan 1, 1968
80.094
+1.362
1.73%
jan 1, 1969
79.76
-0.335
-0.42%
jan 1, 1970
79.882
+0.122
0.15%
jan 1, 1971
79.808
-0.073
-0.09%
jan 1, 1972
73.939
-5.869
-7.35%
jan 1, 1973
75.429
+1.49
2.02%
jan 1, 1974
75.778
+0.349
0.46%
jan 1, 1975
69.716
-6.062
-8.0%
jan 1, 1976
69.924
+0.209
0.3%
jan 1, 1977
71.322
+1.397
2.0%
jan 1, 1978
69.851
-1.471
-2.06%
jan 1, 1979
72.812
+2.961
4.24%
jan 1, 1980
74.009
+1.198
1.64%
jan 1, 1981
69.381
-4.628
-6.25%
jan 1, 1982
65.622
-3.759
-5.42%
jan 1, 1983
70.238
+4.617
7.04%
jan 1, 1984
68.664
-1.575
-2.24%
jan 1, 1985
66.553
-2.111
-3.07%
jan 1, 1986
67.289
+0.736
1.11%
jan 1, 1987
67.375
+0.086
0.13%
jan 1, 1988
67.89
+0.515
0.76%
jan 1, 1989
70.861
+2.971
4.38%
jan 1, 1990
72.001
+1.14
1.61%
jan 1, 1991
67.133
-4.868
-6.76%
jan 1, 1992
66.19
-0.942
-1.4%
jan 1, 1993
67.966
+1.775
2.68%
jan 1, 1994
74.911
+6.946
10.22%
jan 1, 1995
72.199
-2.712
-3.62%
jan 1, 1996
71.61
-0.589
-0.82%
jan 1, 1997
69.592
-2.018
-2.82%
jan 1, 1998
68.304
-1.288
-1.85%
jan 1, 1999
68.88
+0.577
0.84%
jan 1, 2000
81.491
+12.611
18.31%
jan 1, 2001
84.07
+2.579
3.17%
jan 1, 2002
82.589
-1.481
-1.76%
jan 1, 2003
83.307
+0.718
0.87%
jan 1, 2004
83.558
+0.251
0.3%
jan 1, 2005
82.049
-1.508
-1.81%
jan 1, 2006
79.273
-2.777
-3.38%
jan 1, 2007
79.844
+0.571
0.72%
jan 1, 2008
80.164
+0.32
0.4%
jan 1, 2009
73.389
-6.775
-8.45%
jan 1, 2010
76.811
+3.422
4.66%
jan 1, 2011
72.599
-4.212
-5.48%
jan 1, 2012
67.996
-4.603
-6.34%
jan 1, 2013
67.981
-0.015
-0.02%
jan 1, 2014
71.609
+3.628
5.34%
jan 1, 2015
73.374
+1.765
2.46%
Ranking of countries by current statistics by years


Comments: