29
/
en
AIzaSyAYiBZKx7MnpbEhh9jyipgxe19OcubqV5w
April 1, 2024
152783
Hungary
HUN
true
2
1
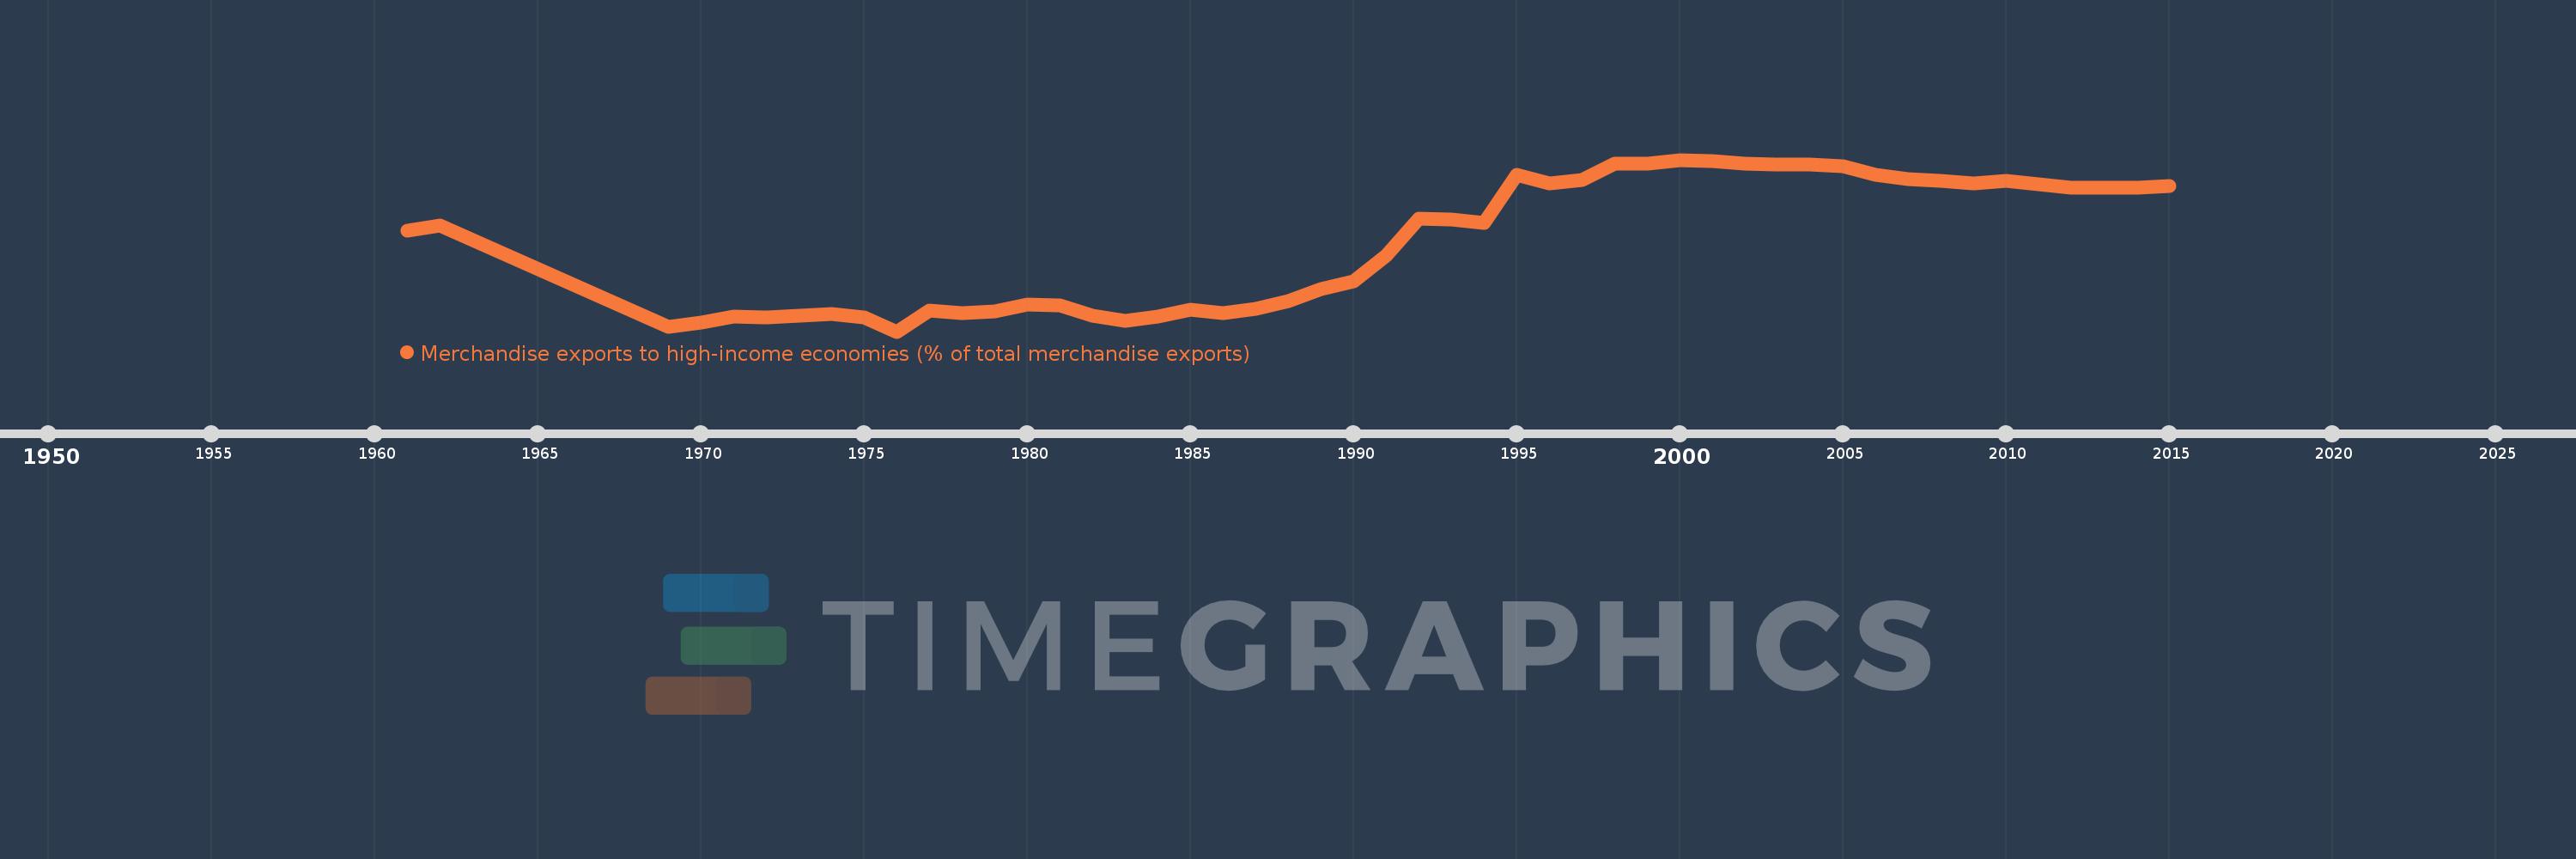
Merchandise exports to high-income economies (% of total merchandise exports)
2015,2014,2013,2012,2011,2010,2009,2008,2007,2006,2005,2004,2003,2002,2001,2000,1999,1998,1997,1996,1995,1994,1993,1992,1991,1990,1989,1988,1987,1986,1985,1984,1983,1982,1981,1980,1979,1978,1977,1976,1975,1974,1973,1972,1971,1970,1969,1962,1961
This statistics in other country:
AfghanistanAlbaniaAlgeriaAmerican SamoaAngolaAntigua and BarbudaArab WorldArgentinaArmeniaArubaAustraliaAustriaAzerbaijanBahamas, TheBahrainBangladeshBarbadosBelarusBelgiumBelizeBeninBermudaBoliviaBosnia and HerzegovinaBrazilBrunei DarussalamBulgariaBurkina FasoBurundiCabo VerdeCambodiaCameroonCanadaCaribbean small statesCentral African RepublicCentral Europe and the BalticsChadChileChinaColombiaComorosCongo, Dem. Rep.Congo, Rep.Costa RicaCote d'IvoireCroatiaCubaCyprusCzech RepublicDenmarkDjiboutiDominicaDominican RepublicEarly-demographic dividendEast Asia & PacificEast Asia & Pacific (excluding high income)East Asia & Pacific (IDA & IBRD countries)EcuadorEgypt, Arab Rep.El SalvadorEquatorial GuineaEstoniaEthiopiaEuro areaEurope & Central AsiaEurope & Central Asia (excluding high income)Europe & Central Asia (IDA & IBRD countries)European UnionFaroe IslandsFijiFinlandFragile and conflict affected situationsFranceFrench PolynesiaGabonGambia, TheGeorgiaGermanyGhanaGibraltarGreeceGreenlandGrenadaGuamGuatemalaGuineaGuinea-BissauGuyanaHaitiHeavily indebted poor countries (HIPC)High incomeHondurasHong Kong SAR, ChinaHungaryIBRD onlyIcelandIDA & IBRD totalIDA blendIDA onlyIDA totalIndiaIndonesiaIran, Islamic Rep.IraqIrelandIsraelItalyJamaicaJapanJordanKazakhstanKenyaKiribatiKorea, Dem. People’s Rep.Korea, Rep.KosovoKuwaitKyrgyz RepublicLao PDRLate-demographic dividendLatin America & Caribbean Latin America & Caribbean (excluding high income)Latin America & the Caribbean (IDA & IBRD countries)LatviaLeast developed countries: UN classificationLebanonLiberiaLibyaLithuaniaLow & middle incomeLow incomeLower middle incomeLuxembourgMacao SAR, ChinaMacedonia, FYRMadagascarMalawiMalaysiaMaldivesMaliMaltaMauritaniaMauritiusMexicoMiddle East & North AfricaMiddle East & North Africa (excluding high income)Middle East & North Africa (IDA & IBRD countries)Middle incomeMoldovaMongoliaMontenegroMoroccoMozambiqueMyanmarNauruNepalNetherlandsNew CaledoniaNew ZealandNicaraguaNigerNigeriaNorth AmericaNorwayOECD membersOmanOther small statesPacific island small statesPakistanPanamaPapua New GuineaParaguayPeruPhilippinesPolandPortugalPost-demographic dividendPre-demographic dividendQatarRomaniaRussian FederationRwandaSamoaSao Tome and PrincipeSaudi ArabiaSenegalSerbiaSeychellesSierra LeoneSingaporeSlovak RepublicSloveniaSmall statesSolomon IslandsSomaliaSouth AfricaSouth AsiaSouth Asia (IDA & IBRD)SpainSri LankaSt. Kitts and NevisSt. LuciaSt. Vincent and the GrenadinesSub-Saharan Africa Sub-Saharan Africa (excluding high income)Sub-Saharan Africa (IDA & IBRD countries)SudanSurinameSwedenSwitzerlandSyrian Arab RepublicTajikistanTanzaniaThailandTogoTongaTrinidad and TobagoTunisiaTurkeyTurkmenistanTuvaluUgandaUkraineUnited Arab EmiratesUnited KingdomUnited StatesUpper middle incomeUruguayUzbekistanVanuatuVenezuela, RBVietnamWorldYemen, Rep.ZambiaZimbabwe Timeline:
This timeline shows a graph from 1961 to 2015 of Hungary. No data until 1960. Number of actual observations by date: 49.
Source name:
World Development Indicators
Source organization:
World Bank staff estimates based data from International Monetary Fund's Direction of Trade database.
Categories, topics:
Private Sector, Trade
Last updated:
apr 23, 2017
Indicators value changes by year
Maximum:
93.449
jan 1, 2000
At the date of observation
Value
Absolute change
Change from previous value
jan 1, 1961
65.005
+65.005
0.0%
jan 1, 1962
67.086
+2.081
3.2%
jan 1, 1969
26.224
-40.862
-60.91%
jan 1, 1970
27.919
+1.694
6.46%
jan 1, 1971
30.361
+2.443
8.75%
jan 1, 1972
29.937
-0.425
-1.4%
jan 1, 1973
30.463
+0.526
1.76%
jan 1, 1974
31.172
+0.709
2.33%
jan 1, 1975
29.999
-1.173
-3.76%
jan 1, 1976
24.19
-5.809
-19.36%
jan 1, 1977
32.662
+8.472
35.02%
jan 1, 1978
31.801
-0.861
-2.64%
jan 1, 1979
32.363
+0.562
1.77%
jan 1, 1980
34.933
+2.57
7.94%
jan 1, 1981
34.727
-0.205
-0.59%
jan 1, 1982
30.515
-4.212
-12.13%
jan 1, 1983
28.355
-2.16
-7.08%
jan 1, 1984
30.113
+1.758
6.2%
jan 1, 1985
32.958
+2.845
9.45%
jan 1, 1986
31.611
-1.347
-4.09%
jan 1, 1987
33.397
+1.787
5.65%
jan 1, 1988
36.412
+3.014
9.03%
jan 1, 1989
41.496
+5.084
13.96%
jan 1, 1990
44.409
+2.913
7.02%
jan 1, 1991
54.783
+10.374
23.36%
jan 1, 1992
69.788
+15.005
27.39%
jan 1, 1993
69.55
-0.238
-0.34%
jan 1, 1994
68.04
-1.509
-2.17%
jan 1, 1995
87.554
+19.514
28.68%
jan 1, 1996
83.936
-3.618
-4.13%
jan 1, 1997
85.364
+1.427
1.7%
jan 1, 1998
91.968
+6.604
7.74%
jan 1, 1999
91.82
-0.148
-0.16%
jan 1, 2000
93.449
+1.629
1.77%
jan 1, 2001
92.871
-0.578
-0.62%
jan 1, 2002
92.05
-0.821
-0.88%
jan 1, 2003
91.542
-0.509
-0.55%
jan 1, 2004
91.45
-0.092
-0.1%
jan 1, 2005
90.881
-0.569
-0.62%
jan 1, 2006
87.425
-3.456
-3.8%
jan 1, 2007
85.666
-1.758
-2.01%
jan 1, 2008
84.812
-0.855
-1.0%
jan 1, 2009
83.886
-0.925
-1.09%
jan 1, 2010
84.858
+0.972
1.16%
jan 1, 2011
83.669
-1.19
-1.4%
jan 1, 2012
82.363
-1.305
-1.56%
jan 1, 2013
82.115
-0.248
-0.3%
jan 1, 2014
82.313
+0.197
0.24%
jan 1, 2015
82.794
+0.481
0.58%
Ranking of countries by current statistics by years


Comments: