29
/
en
AIzaSyAYiBZKx7MnpbEhh9jyipgxe19OcubqV5w
April 1, 2024
117142
Cyprus
CYP
true
2
1
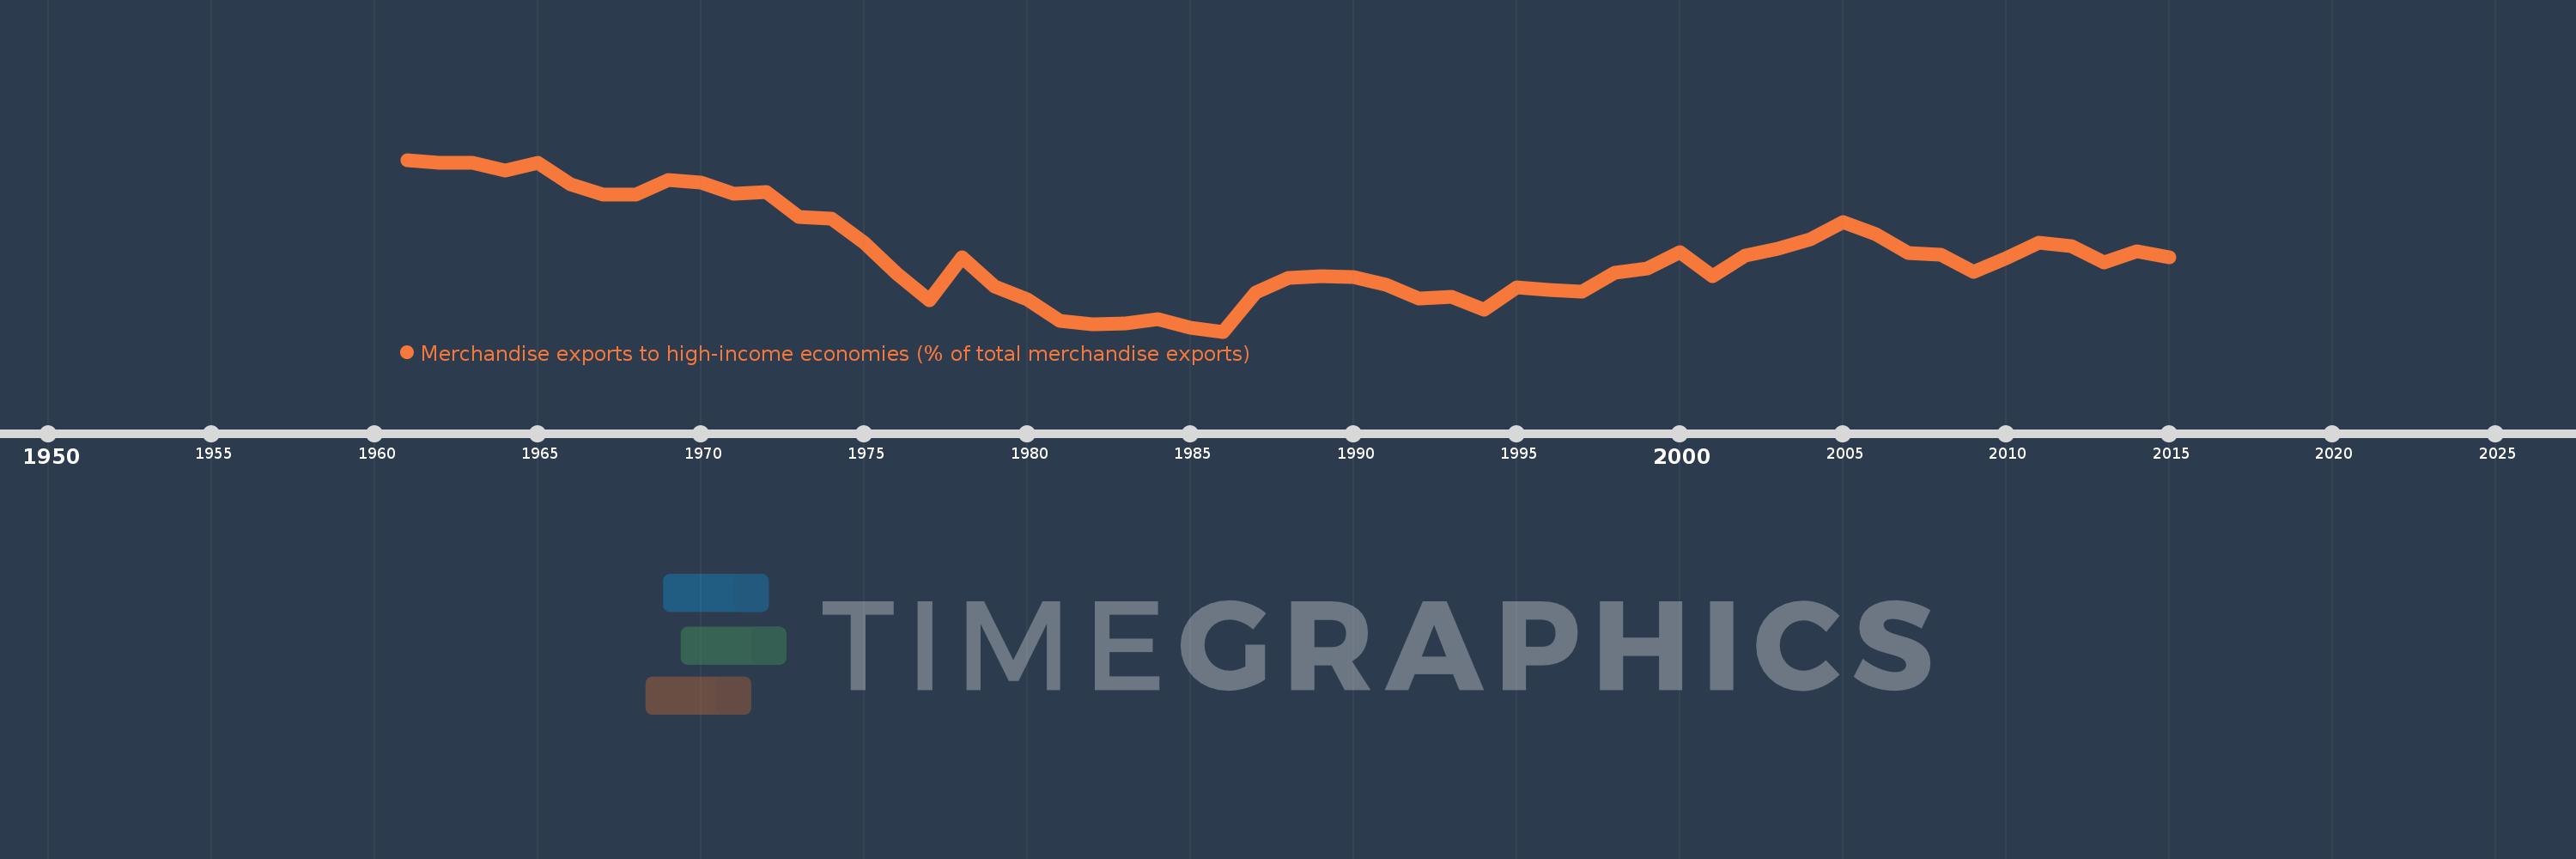
Merchandise exports to high-income economies (% of total merchandise exports)
2015,2014,2013,2012,2011,2010,2009,2008,2007,2006,2005,2004,2003,2002,2001,2000,1999,1998,1997,1996,1995,1994,1993,1992,1991,1990,1989,1988,1987,1986,1985,1984,1983,1982,1981,1980,1979,1978,1977,1976,1975,1974,1973,1972,1971,1970,1969,1968,1967,1966,1965,1964,1963,1962,1961
This statistics in other country:
AfghanistanAlbaniaAlgeriaAmerican SamoaAngolaAntigua and BarbudaArab WorldArgentinaArmeniaArubaAustraliaAustriaAzerbaijanBahamas, TheBahrainBangladeshBarbadosBelarusBelgiumBelizeBeninBermudaBoliviaBosnia and HerzegovinaBrazilBrunei DarussalamBulgariaBurkina FasoBurundiCabo VerdeCambodiaCameroonCanadaCaribbean small statesCentral African RepublicCentral Europe and the BalticsChadChileChinaColombiaComorosCongo, Dem. Rep.Congo, Rep.Costa RicaCote d'IvoireCroatiaCubaCyprusCzech RepublicDenmarkDjiboutiDominicaDominican RepublicEarly-demographic dividendEast Asia & PacificEast Asia & Pacific (excluding high income)East Asia & Pacific (IDA & IBRD countries)EcuadorEgypt, Arab Rep.El SalvadorEquatorial GuineaEstoniaEthiopiaEuro areaEurope & Central AsiaEurope & Central Asia (excluding high income)Europe & Central Asia (IDA & IBRD countries)European UnionFaroe IslandsFijiFinlandFragile and conflict affected situationsFranceFrench PolynesiaGabonGambia, TheGeorgiaGermanyGhanaGibraltarGreeceGreenlandGrenadaGuamGuatemalaGuineaGuinea-BissauGuyanaHaitiHeavily indebted poor countries (HIPC)High incomeHondurasHong Kong SAR, ChinaHungaryIBRD onlyIcelandIDA & IBRD totalIDA blendIDA onlyIDA totalIndiaIndonesiaIran, Islamic Rep.IraqIrelandIsraelItalyJamaicaJapanJordanKazakhstanKenyaKiribatiKorea, Dem. People’s Rep.Korea, Rep.KosovoKuwaitKyrgyz RepublicLao PDRLate-demographic dividendLatin America & Caribbean Latin America & Caribbean (excluding high income)Latin America & the Caribbean (IDA & IBRD countries)LatviaLeast developed countries: UN classificationLebanonLiberiaLibyaLithuaniaLow & middle incomeLow incomeLower middle incomeLuxembourgMacao SAR, ChinaMacedonia, FYRMadagascarMalawiMalaysiaMaldivesMaliMaltaMauritaniaMauritiusMexicoMiddle East & North AfricaMiddle East & North Africa (excluding high income)Middle East & North Africa (IDA & IBRD countries)Middle incomeMoldovaMongoliaMontenegroMoroccoMozambiqueMyanmarNauruNepalNetherlandsNew CaledoniaNew ZealandNicaraguaNigerNigeriaNorth AmericaNorwayOECD membersOmanOther small statesPacific island small statesPakistanPanamaPapua New GuineaParaguayPeruPhilippinesPolandPortugalPost-demographic dividendPre-demographic dividendQatarRomaniaRussian FederationRwandaSamoaSao Tome and PrincipeSaudi ArabiaSenegalSerbiaSeychellesSierra LeoneSingaporeSlovak RepublicSloveniaSmall statesSolomon IslandsSomaliaSouth AfricaSouth AsiaSouth Asia (IDA & IBRD)SpainSri LankaSt. Kitts and NevisSt. LuciaSt. Vincent and the GrenadinesSub-Saharan Africa Sub-Saharan Africa (excluding high income)Sub-Saharan Africa (IDA & IBRD countries)SudanSurinameSwedenSwitzerlandSyrian Arab RepublicTajikistanTanzaniaThailandTogoTongaTrinidad and TobagoTunisiaTurkeyTurkmenistanTuvaluUgandaUkraineUnited Arab EmiratesUnited KingdomUnited StatesUpper middle incomeUruguayUzbekistanVanuatuVenezuela, RBVietnamWorldYemen, Rep.ZambiaZimbabwe Timeline:
This timeline shows a graph from 1961 to 2015 of Cyprus. No data until 1960. Number of actual observations by date: 55.
Source name:
World Development Indicators
Source organization:
World Bank staff estimates based data from International Monetary Fund's Direction of Trade database.
Categories, topics:
Private Sector, Trade
Last updated:
apr 23, 2017
Indicators value changes by year
Minimum:
47.837
jan 1, 1986
Maximum:
89.513
jan 1, 1961
At the date of observation
Value
Absolute change
Change from previous value
jan 1, 1961
89.513
+89.513
0.0%
jan 1, 1962
88.776
-0.738
-0.82%
jan 1, 1963
88.696
-0.08
-0.09%
jan 1, 1964
86.949
-1.746
-1.97%
jan 1, 1965
88.811
+1.862
2.14%
jan 1, 1966
83.504
-5.308
-5.98%
jan 1, 1967
81.074
-2.429
-2.91%
jan 1, 1968
81.098
+0.023
0.03%
jan 1, 1969
84.624
+3.527
4.35%
jan 1, 1970
84.056
-0.568
-0.67%
jan 1, 1971
81.205
-2.851
-3.39%
jan 1, 1972
81.623
+0.418
0.51%
jan 1, 1973
75.73
-5.892
-7.22%
jan 1, 1974
75.279
-0.451
-0.6%
jan 1, 1975
69.358
-5.921
-7.87%
jan 1, 1976
61.834
-7.524
-10.85%
jan 1, 1977
55.352
-6.482
-10.48%
jan 1, 1978
65.768
+10.417
18.82%
jan 1, 1979
58.82
-6.949
-10.57%
jan 1, 1980
55.576
-3.244
-5.52%
jan 1, 1981
50.509
-5.066
-9.12%
jan 1, 1982
49.69
-0.819
-1.62%
jan 1, 1983
49.905
+0.214
0.43%
jan 1, 1984
50.922
+1.017
2.04%
jan 1, 1985
48.673
-2.249
-4.42%
jan 1, 1986
47.837
-0.836
-1.72%
jan 1, 1987
57.364
+9.527
19.92%
jan 1, 1988
60.925
+3.56
6.21%
jan 1, 1989
61.259
+0.335
0.55%
jan 1, 1990
61.022
-0.238
-0.39%
jan 1, 1991
59.221
-1.8
-2.95%
jan 1, 1992
55.759
-3.463
-5.85%
jan 1, 1993
56.249
+0.491
0.88%
jan 1, 1994
53.105
-3.145
-5.59%
jan 1, 1995
58.508
+5.403
10.18%
jan 1, 1996
58.045
-0.463
-0.79%
jan 1, 1997
57.546
-0.499
-0.86%
jan 1, 1998
62.196
+4.65
8.08%
jan 1, 1999
63.141
+0.945
1.52%
jan 1, 2000
67.063
+3.922
6.21%
jan 1, 2001
61.308
-5.755
-8.58%
jan 1, 2002
66.304
+4.996
8.15%
jan 1, 2003
67.909
+1.605
2.42%
jan 1, 2004
70.267
+2.358
3.47%
jan 1, 2005
74.5
+4.233
6.02%
jan 1, 2006
71.585
-2.915
-3.91%
jan 1, 2007
66.814
-4.771
-6.66%
jan 1, 2008
66.462
-0.352
-0.53%
jan 1, 2009
62.405
-4.057
-6.1%
jan 1, 2010
65.63
+3.225
5.17%
jan 1, 2011
69.391
+3.761
5.73%
jan 1, 2012
68.586
-0.806
-1.16%
jan 1, 2013
64.604
-3.982
-5.81%
jan 1, 2014
67.287
+2.683
4.15%
jan 1, 2015
65.772
-1.516
-2.25%
Ranking of countries by current statistics by years


Comments: