29
/
en
AIzaSyAYiBZKx7MnpbEhh9jyipgxe19OcubqV5w
April 1, 2024
249003
Sri Lanka
LKA
true
2
1
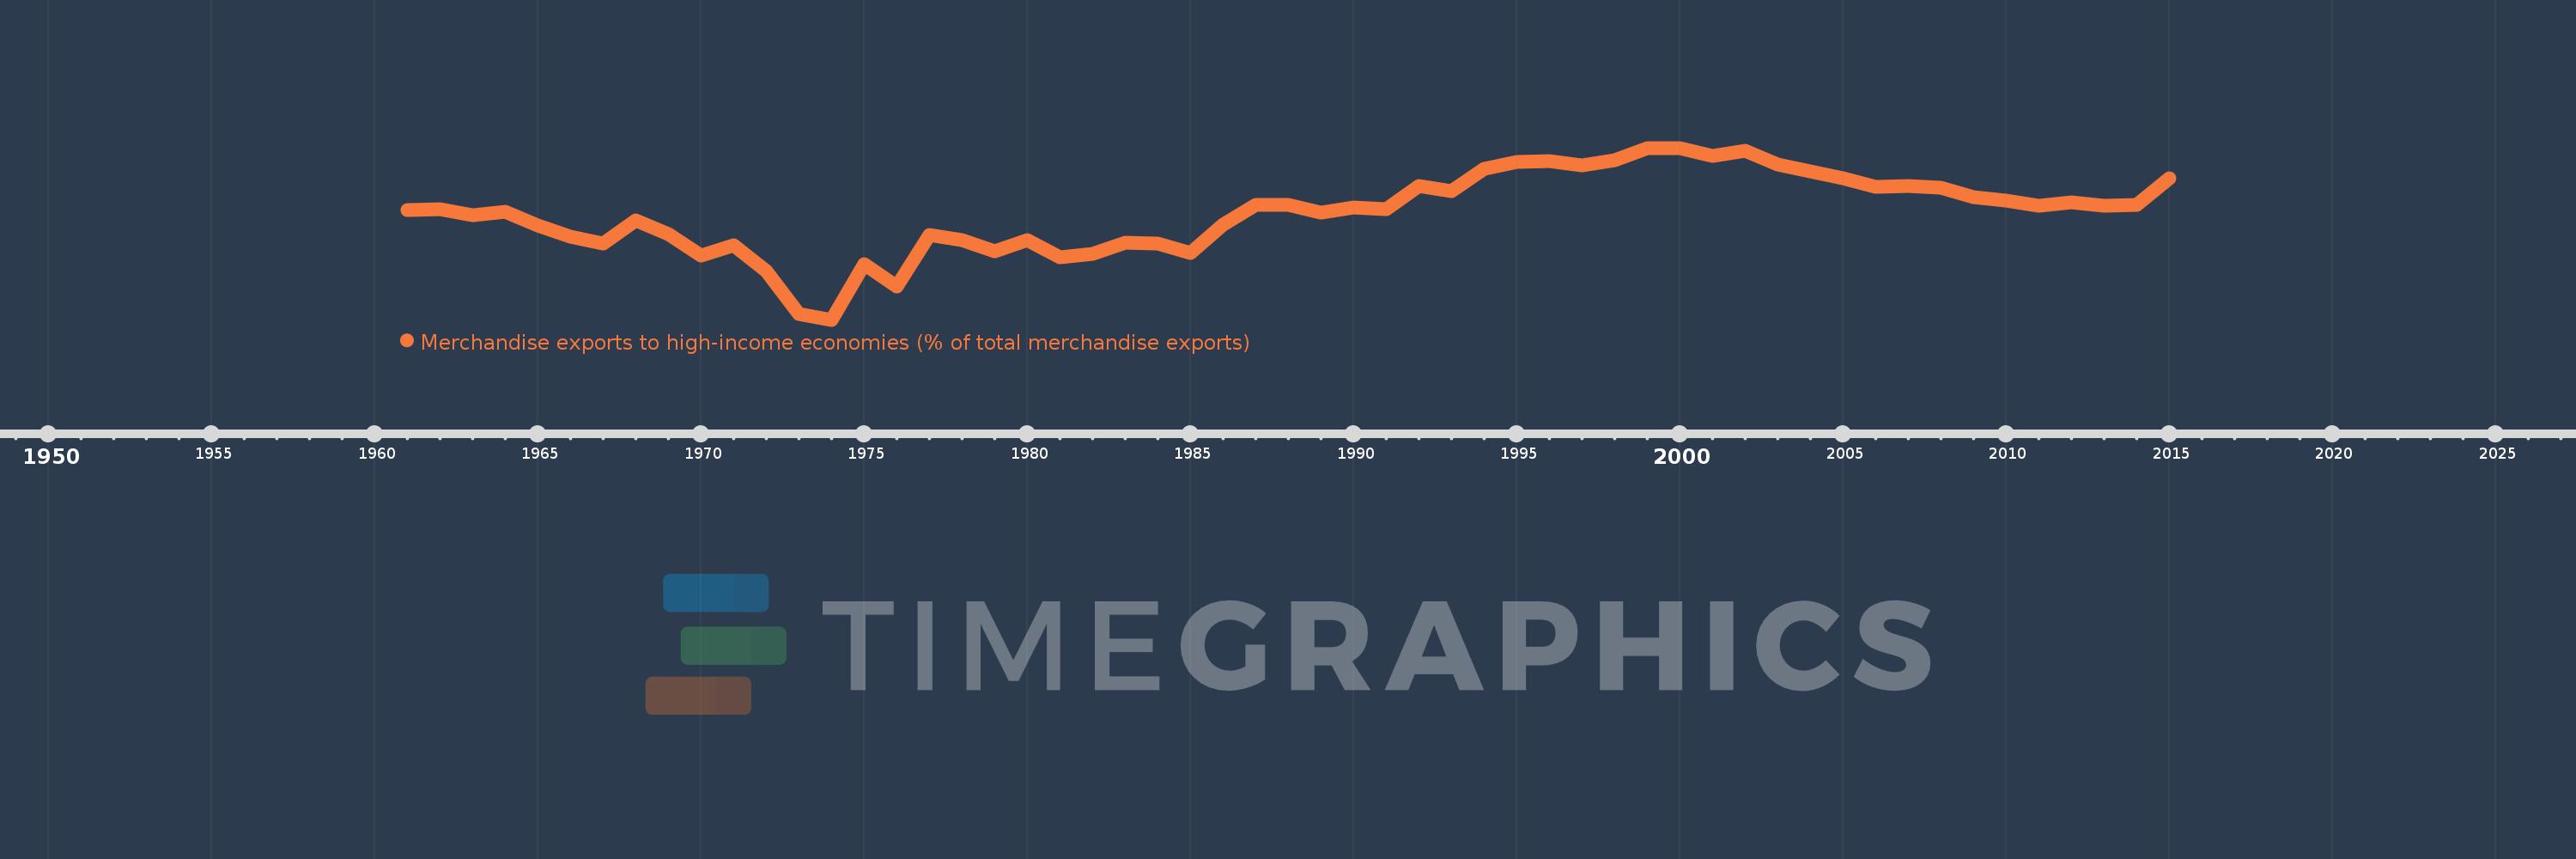
Merchandise exports to high-income economies (% of total merchandise exports)
2015,2014,2013,2012,2011,2010,2009,2008,2007,2006,2005,2004,2003,2002,2001,2000,1999,1998,1997,1996,1995,1994,1993,1992,1991,1990,1989,1988,1987,1986,1985,1984,1983,1982,1981,1980,1979,1978,1977,1976,1975,1974,1973,1972,1971,1970,1969,1968,1967,1966,1965,1964,1963,1962,1961
This statistics in other country:
AfghanistanAlbaniaAlgeriaAmerican SamoaAngolaAntigua and BarbudaArab WorldArgentinaArmeniaArubaAustraliaAustriaAzerbaijanBahamas, TheBahrainBangladeshBarbadosBelarusBelgiumBelizeBeninBermudaBoliviaBosnia and HerzegovinaBrazilBrunei DarussalamBulgariaBurkina FasoBurundiCabo VerdeCambodiaCameroonCanadaCaribbean small statesCentral African RepublicCentral Europe and the BalticsChadChileChinaColombiaComorosCongo, Dem. Rep.Congo, Rep.Costa RicaCote d'IvoireCroatiaCubaCyprusCzech RepublicDenmarkDjiboutiDominicaDominican RepublicEarly-demographic dividendEast Asia & PacificEast Asia & Pacific (excluding high income)East Asia & Pacific (IDA & IBRD countries)EcuadorEgypt, Arab Rep.El SalvadorEquatorial GuineaEstoniaEthiopiaEuro areaEurope & Central AsiaEurope & Central Asia (excluding high income)Europe & Central Asia (IDA & IBRD countries)European UnionFaroe IslandsFijiFinlandFragile and conflict affected situationsFranceFrench PolynesiaGabonGambia, TheGeorgiaGermanyGhanaGibraltarGreeceGreenlandGrenadaGuamGuatemalaGuineaGuinea-BissauGuyanaHaitiHeavily indebted poor countries (HIPC)High incomeHondurasHong Kong SAR, ChinaHungaryIBRD onlyIcelandIDA & IBRD totalIDA blendIDA onlyIDA totalIndiaIndonesiaIran, Islamic Rep.IraqIrelandIsraelItalyJamaicaJapanJordanKazakhstanKenyaKiribatiKorea, Dem. People’s Rep.Korea, Rep.KosovoKuwaitKyrgyz RepublicLao PDRLate-demographic dividendLatin America & Caribbean Latin America & Caribbean (excluding high income)Latin America & the Caribbean (IDA & IBRD countries)LatviaLeast developed countries: UN classificationLebanonLiberiaLibyaLithuaniaLow & middle incomeLow incomeLower middle incomeLuxembourgMacao SAR, ChinaMacedonia, FYRMadagascarMalawiMalaysiaMaldivesMaliMaltaMauritaniaMauritiusMexicoMiddle East & North AfricaMiddle East & North Africa (excluding high income)Middle East & North Africa (IDA & IBRD countries)Middle incomeMoldovaMongoliaMontenegroMoroccoMozambiqueMyanmarNauruNepalNetherlandsNew CaledoniaNew ZealandNicaraguaNigerNigeriaNorth AmericaNorwayOECD membersOmanOther small statesPacific island small statesPakistanPanamaPapua New GuineaParaguayPeruPhilippinesPolandPortugalPost-demographic dividendPre-demographic dividendQatarRomaniaRussian FederationRwandaSamoaSao Tome and PrincipeSaudi ArabiaSenegalSerbiaSeychellesSierra LeoneSingaporeSlovak RepublicSloveniaSmall statesSolomon IslandsSomaliaSouth AfricaSouth AsiaSouth Asia (IDA & IBRD)SpainSri LankaSt. Kitts and NevisSt. LuciaSt. Vincent and the GrenadinesSub-Saharan Africa Sub-Saharan Africa (excluding high income)Sub-Saharan Africa (IDA & IBRD countries)SudanSurinameSwedenSwitzerlandSyrian Arab RepublicTajikistanTanzaniaThailandTogoTongaTrinidad and TobagoTunisiaTurkeyTurkmenistanTuvaluUgandaUkraineUnited Arab EmiratesUnited KingdomUnited StatesUpper middle incomeUruguayUzbekistanVanuatuVenezuela, RBVietnamWorldYemen, Rep.ZambiaZimbabwe Timeline:
This timeline shows a graph from 1961 to 2015 of Sri Lanka. No data until 1960. Number of actual observations by date: 55.
Source name:
World Development Indicators
Source organization:
World Bank staff estimates based data from International Monetary Fund's Direction of Trade database.
Categories, topics:
Private Sector, Trade
Last updated:
apr 23, 2017
Indicators value changes by year
Maximum:
84.732
jan 1, 2000
At the date of observation
Value
Absolute change
Change from previous value
jan 1, 1961
65.593
+65.593
0.0%
jan 1, 1962
65.977
+0.384
0.59%
jan 1, 1963
63.95
-2.027
-3.07%
jan 1, 1964
65.187
+1.237
1.93%
jan 1, 1965
60.734
-4.453
-6.83%
jan 1, 1966
57.314
-3.419
-5.63%
jan 1, 1967
55.36
-1.955
-3.41%
jan 1, 1968
62.352
+6.992
12.63%
jan 1, 1969
58.273
-4.079
-6.54%
jan 1, 1970
51.72
-6.553
-11.24%
jan 1, 1971
54.68
+2.959
5.72%
jan 1, 1972
46.775
-7.904
-14.46%
jan 1, 1973
33.682
-13.093
-27.99%
jan 1, 1974
31.85
-1.833
-5.44%
jan 1, 1975
48.955
+17.105
53.71%
jan 1, 1976
41.99
-6.965
-14.23%
jan 1, 1977
58.065
+16.075
38.28%
jan 1, 1978
56.385
-1.68
-2.89%
jan 1, 1979
53.037
-3.348
-5.94%
jan 1, 1980
56.438
+3.401
6.41%
jan 1, 1981
51.163
-5.275
-9.35%
jan 1, 1982
52.081
+0.917
1.79%
jan 1, 1983
55.457
+3.376
6.48%
jan 1, 1984
55.173
-0.284
-0.51%
jan 1, 1985
52.44
-2.733
-4.95%
jan 1, 1986
61.092
+8.652
16.5%
jan 1, 1987
67.32
+6.228
10.19%
jan 1, 1988
67.303
-0.016
-0.02%
jan 1, 1989
64.804
-2.5
-3.71%
jan 1, 1990
66.298
+1.495
2.31%
jan 1, 1991
65.876
-0.422
-0.64%
jan 1, 1992
72.976
+7.1
10.78%
jan 1, 1993
71.378
-1.598
-2.19%
jan 1, 1994
78.423
+7.044
9.87%
jan 1, 1995
80.431
+2.009
2.56%
jan 1, 1996
80.768
+0.337
0.42%
jan 1, 1997
79.261
-1.507
-1.87%
jan 1, 1998
80.925
+1.663
2.1%
jan 1, 1999
84.569
+3.644
4.5%
jan 1, 2000
84.732
+0.163
0.19%
jan 1, 2001
82.333
-2.399
-2.83%
jan 1, 2002
83.744
+1.411
1.71%
jan 1, 2003
79.76
-3.984
-4.76%
jan 1, 2004
77.503
-2.257
-2.83%
jan 1, 2005
75.464
-2.039
-2.63%
jan 1, 2006
72.649
-2.815
-3.73%
jan 1, 2007
73.011
+0.362
0.5%
jan 1, 2008
72.386
-0.625
-0.86%
jan 1, 2009
69.6
-2.786
-3.85%
jan 1, 2010
68.483
-1.117
-1.6%
jan 1, 2011
67.068
-1.415
-2.07%
jan 1, 2012
67.935
+0.867
1.29%
jan 1, 2013
66.896
-1.039
-1.53%
jan 1, 2014
67.299
+0.403
0.6%
jan 1, 2015
75.423
+8.124
12.07%
Ranking of countries by current statistics by years


Comments: