29
/
en
AIzaSyAYiBZKx7MnpbEhh9jyipgxe19OcubqV5w
April 1, 2024
171941
Kuwait
KWT
true
2
1
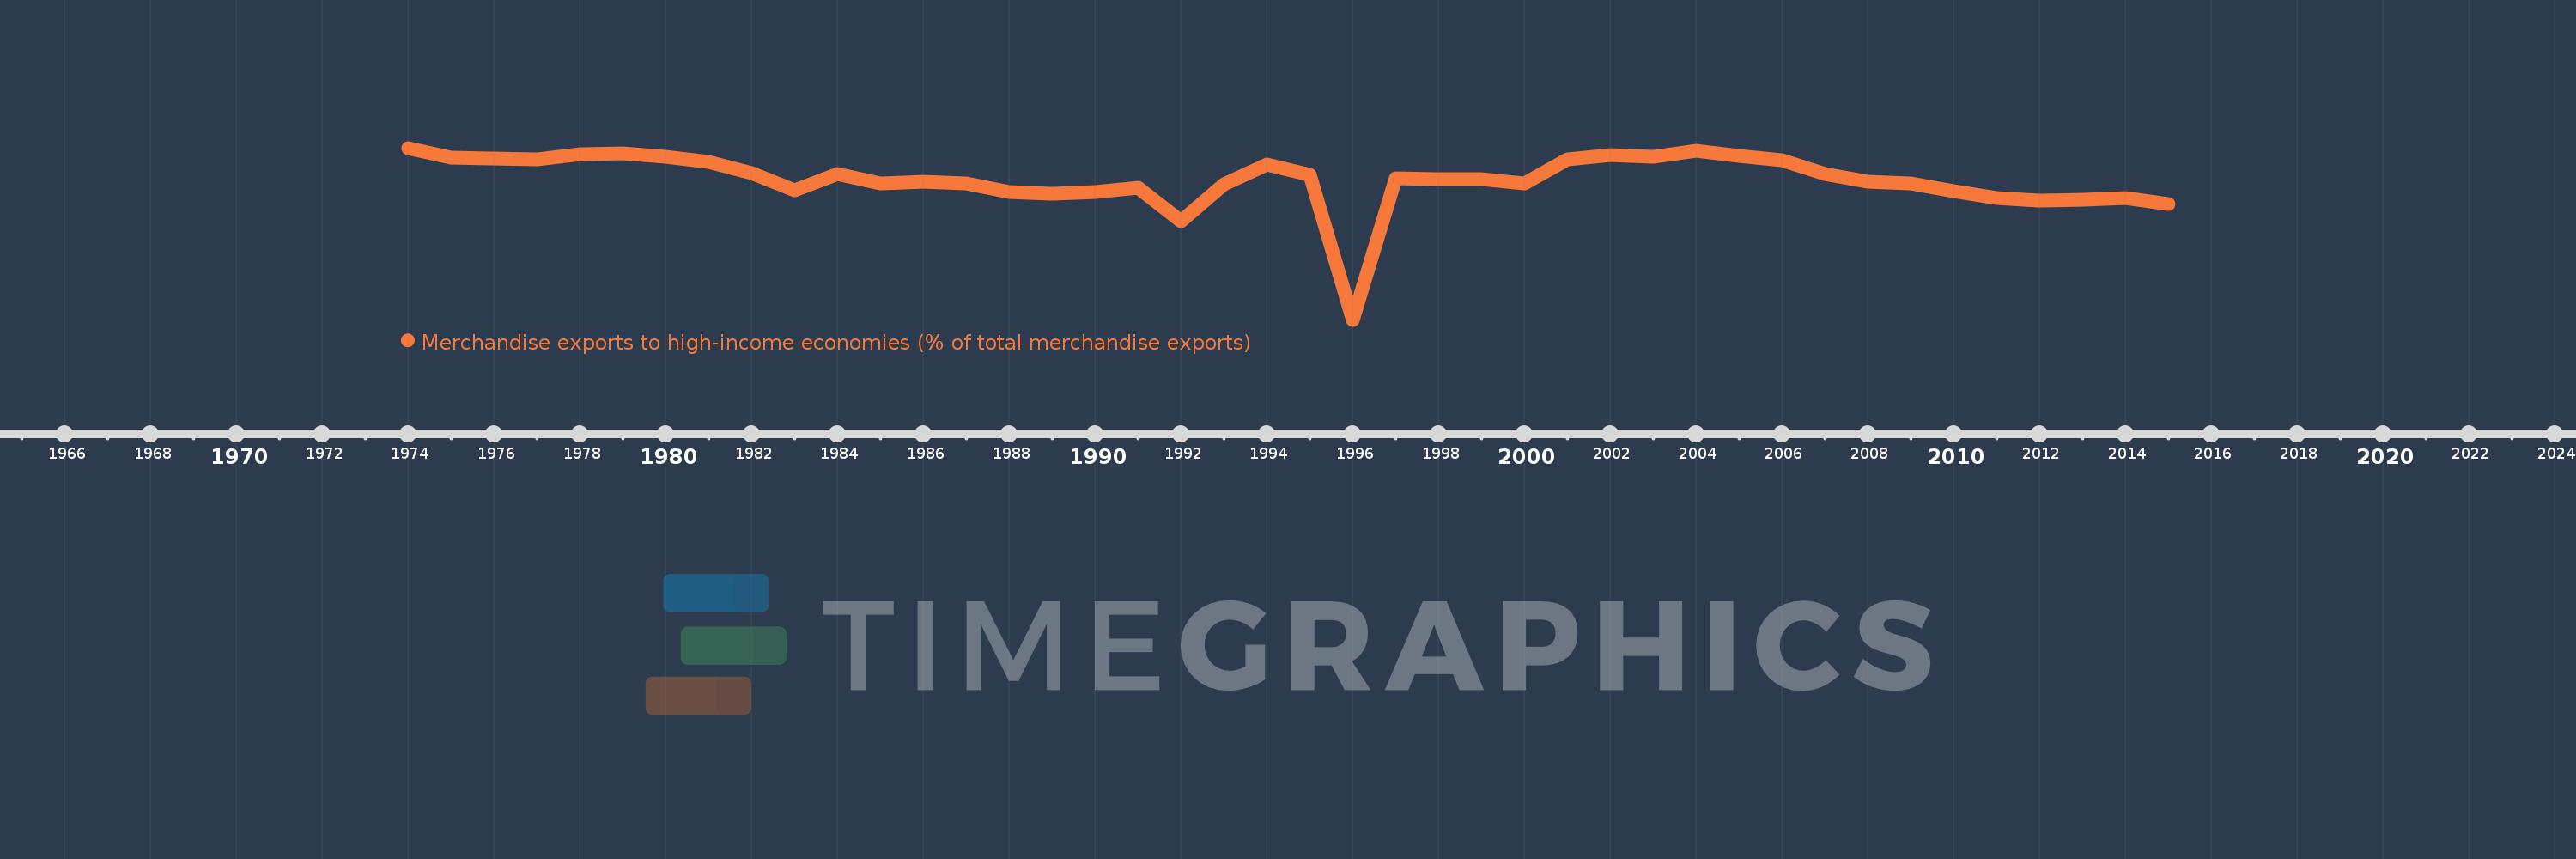
Merchandise exports to high-income economies (% of total merchandise exports)
2015,2014,2013,2012,2011,2010,2009,2008,2007,2006,2005,2004,2003,2002,2001,2000,1999,1998,1997,1996,1995,1994,1993,1992,1991,1990,1989,1988,1987,1986,1985,1984,1983,1982,1981,1980,1979,1978,1977,1976,1975,1974
This statistics in other country:
AfghanistanAlbaniaAlgeriaAmerican SamoaAngolaAntigua and BarbudaArab WorldArgentinaArmeniaArubaAustraliaAustriaAzerbaijanBahamas, TheBahrainBangladeshBarbadosBelarusBelgiumBelizeBeninBermudaBoliviaBosnia and HerzegovinaBrazilBrunei DarussalamBulgariaBurkina FasoBurundiCabo VerdeCambodiaCameroonCanadaCaribbean small statesCentral African RepublicCentral Europe and the BalticsChadChileChinaColombiaComorosCongo, Dem. Rep.Congo, Rep.Costa RicaCote d'IvoireCroatiaCubaCyprusCzech RepublicDenmarkDjiboutiDominicaDominican RepublicEarly-demographic dividendEast Asia & PacificEast Asia & Pacific (excluding high income)East Asia & Pacific (IDA & IBRD countries)EcuadorEgypt, Arab Rep.El SalvadorEquatorial GuineaEstoniaEthiopiaEuro areaEurope & Central AsiaEurope & Central Asia (excluding high income)Europe & Central Asia (IDA & IBRD countries)European UnionFaroe IslandsFijiFinlandFragile and conflict affected situationsFranceFrench PolynesiaGabonGambia, TheGeorgiaGermanyGhanaGibraltarGreeceGreenlandGrenadaGuamGuatemalaGuineaGuinea-BissauGuyanaHaitiHeavily indebted poor countries (HIPC)High incomeHondurasHong Kong SAR, ChinaHungaryIBRD onlyIcelandIDA & IBRD totalIDA blendIDA onlyIDA totalIndiaIndonesiaIran, Islamic Rep.IraqIrelandIsraelItalyJamaicaJapanJordanKazakhstanKenyaKiribatiKorea, Dem. People’s Rep.Korea, Rep.KosovoKuwaitKyrgyz RepublicLao PDRLate-demographic dividendLatin America & Caribbean Latin America & Caribbean (excluding high income)Latin America & the Caribbean (IDA & IBRD countries)LatviaLeast developed countries: UN classificationLebanonLiberiaLibyaLithuaniaLow & middle incomeLow incomeLower middle incomeLuxembourgMacao SAR, ChinaMacedonia, FYRMadagascarMalawiMalaysiaMaldivesMaliMaltaMauritaniaMauritiusMexicoMiddle East & North AfricaMiddle East & North Africa (excluding high income)Middle East & North Africa (IDA & IBRD countries)Middle incomeMoldovaMongoliaMontenegroMoroccoMozambiqueMyanmarNauruNepalNetherlandsNew CaledoniaNew ZealandNicaraguaNigerNigeriaNorth AmericaNorwayOECD membersOmanOther small statesPacific island small statesPakistanPanamaPapua New GuineaParaguayPeruPhilippinesPolandPortugalPost-demographic dividendPre-demographic dividendQatarRomaniaRussian FederationRwandaSamoaSao Tome and PrincipeSaudi ArabiaSenegalSerbiaSeychellesSierra LeoneSingaporeSlovak RepublicSloveniaSmall statesSolomon IslandsSomaliaSouth AfricaSouth AsiaSouth Asia (IDA & IBRD)SpainSri LankaSt. Kitts and NevisSt. LuciaSt. Vincent and the GrenadinesSub-Saharan Africa Sub-Saharan Africa (excluding high income)Sub-Saharan Africa (IDA & IBRD countries)SudanSurinameSwedenSwitzerlandSyrian Arab RepublicTajikistanTanzaniaThailandTogoTongaTrinidad and TobagoTunisiaTurkeyTurkmenistanTuvaluUgandaUkraineUnited Arab EmiratesUnited KingdomUnited StatesUpper middle incomeUruguayUzbekistanVanuatuVenezuela, RBVietnamWorldYemen, Rep.ZambiaZimbabwe Timeline:
This timeline shows a graph from 1974 to 2015 of Kuwait. No data until 1973. Number of actual observations by date: 42.
Source name:
World Development Indicators
Source organization:
World Bank staff estimates based data from International Monetary Fund's Direction of Trade database.
Categories, topics:
Private Sector, Trade
Last updated:
apr 23, 2017
Indicators value changes by year
Maximum:
85.196
jan 1, 1974
At the date of observation
Value
Absolute change
Change from previous value
jan 1, 1974
85.196
+85.196
0.0%
jan 1, 1975
80.338
-4.858
-5.7%
jan 1, 1976
80.201
-0.137
-0.17%
jan 1, 1977
79.721
-0.48
-0.6%
jan 1, 1978
82.377
+2.655
3.33%
jan 1, 1979
82.779
+0.403
0.49%
jan 1, 1980
81.052
-1.728
-2.09%
jan 1, 1981
78.59
-2.462
-3.04%
jan 1, 1982
72.911
-5.679
-7.23%
jan 1, 1983
64.964
-7.947
-10.9%
jan 1, 1984
72.626
+7.661
11.79%
jan 1, 1985
68.214
-4.412
-6.08%
jan 1, 1986
68.873
+0.66
0.97%
jan 1, 1987
68.028
-0.845
-1.23%
jan 1, 1988
63.902
-4.126
-6.07%
jan 1, 1989
63.02
-0.881
-1.38%
jan 1, 1990
64.038
+1.018
1.62%
jan 1, 1991
66.053
+2.015
3.15%
jan 1, 1992
50.173
-15.88
-24.04%
jan 1, 1993
67.726
+17.553
34.98%
jan 1, 1994
77.125
+9.399
13.88%
jan 1, 1995
72.386
-4.739
-6.14%
jan 1, 1996
2.722
-69.664
-96.24%
jan 1, 1997
70.6
+67.878
2.49K%
jan 1, 1998
70.298
-0.303
-0.43%
jan 1, 1999
70.2
-0.098
-0.14%
jan 1, 2000
67.969
-2.231
-3.18%
jan 1, 2001
79.738
+11.769
17.31%
jan 1, 2002
81.74
+2.002
2.51%
jan 1, 2003
81.007
-0.733
-0.9%
jan 1, 2004
83.686
+2.679
3.31%
jan 1, 2005
81.372
-2.314
-2.76%
jan 1, 2006
79.462
-1.911
-2.35%
jan 1, 2007
72.876
-6.586
-8.29%
jan 1, 2008
68.892
-3.984
-5.47%
jan 1, 2009
68.071
-0.821
-1.19%
jan 1, 2010
64.367
-3.704
-5.44%
jan 1, 2011
61.297
-3.07
-4.77%
jan 1, 2012
60.115
-1.182
-1.93%
jan 1, 2013
60.448
+0.333
0.55%
jan 1, 2014
60.958
+0.51
0.84%
jan 1, 2015
58.474
-2.484
-4.08%
Ranking of countries by current statistics by years


Comments: