29
/
en
AIzaSyAYiBZKx7MnpbEhh9jyipgxe19OcubqV5w
April 1, 2024
76400
Bahamas, The
BHS
true
2
1
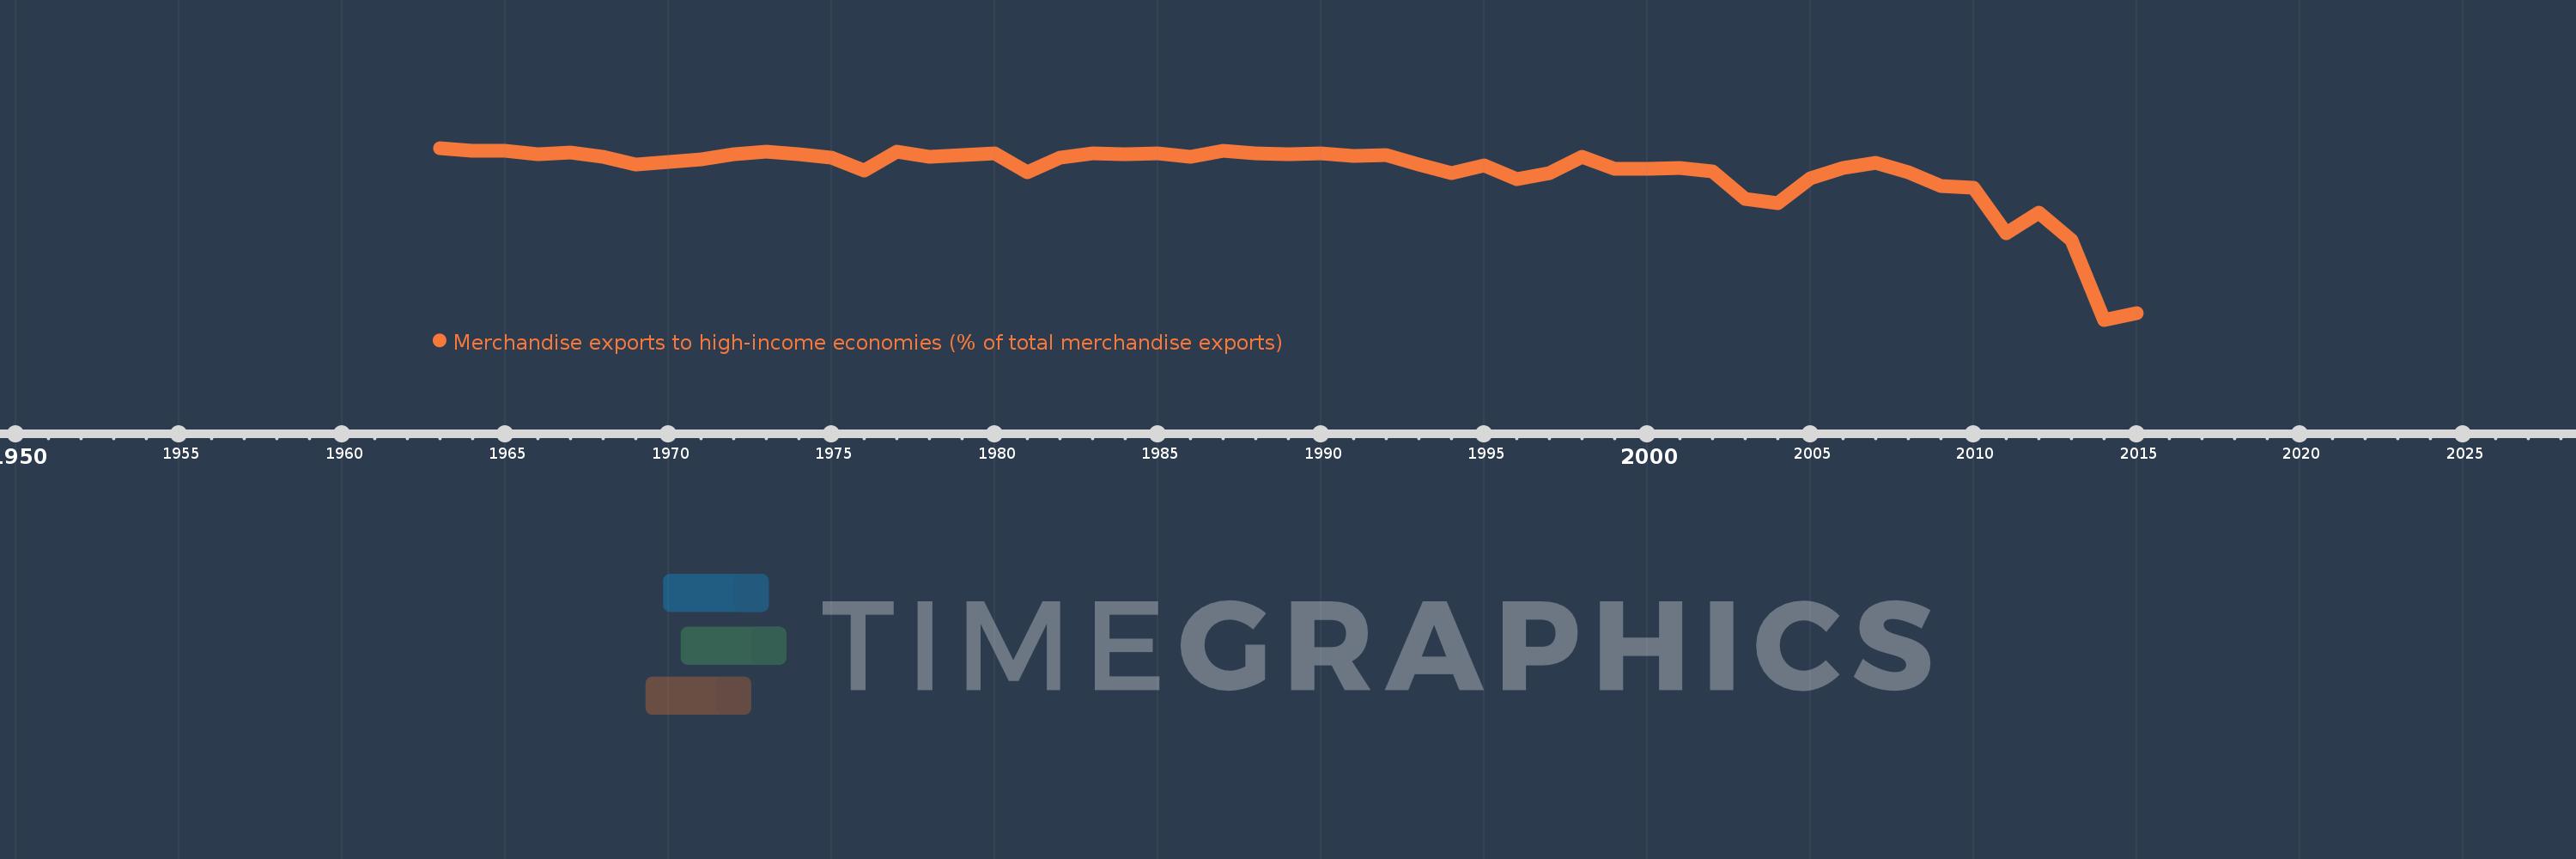
Merchandise exports to high-income economies (% of total merchandise exports)
2015,2014,2013,2012,2011,2010,2009,2008,2007,2006,2005,2004,2003,2002,2001,2000,1999,1998,1997,1996,1995,1994,1993,1992,1991,1990,1989,1988,1987,1986,1985,1984,1983,1982,1981,1980,1979,1978,1977,1976,1975,1974,1973,1972,1971,1970,1969,1968,1967,1966,1965,1964,1963
This statistics in other country:
AfghanistanAlbaniaAlgeriaAmerican SamoaAngolaAntigua and BarbudaArab WorldArgentinaArmeniaArubaAustraliaAustriaAzerbaijanBahamas, TheBahrainBangladeshBarbadosBelarusBelgiumBelizeBeninBermudaBoliviaBosnia and HerzegovinaBrazilBrunei DarussalamBulgariaBurkina FasoBurundiCabo VerdeCambodiaCameroonCanadaCaribbean small statesCentral African RepublicCentral Europe and the BalticsChadChileChinaColombiaComorosCongo, Dem. Rep.Congo, Rep.Costa RicaCote d'IvoireCroatiaCubaCyprusCzech RepublicDenmarkDjiboutiDominicaDominican RepublicEarly-demographic dividendEast Asia & PacificEast Asia & Pacific (excluding high income)East Asia & Pacific (IDA & IBRD countries)EcuadorEgypt, Arab Rep.El SalvadorEquatorial GuineaEstoniaEthiopiaEuro areaEurope & Central AsiaEurope & Central Asia (excluding high income)Europe & Central Asia (IDA & IBRD countries)European UnionFaroe IslandsFijiFinlandFragile and conflict affected situationsFranceFrench PolynesiaGabonGambia, TheGeorgiaGermanyGhanaGibraltarGreeceGreenlandGrenadaGuamGuatemalaGuineaGuinea-BissauGuyanaHaitiHeavily indebted poor countries (HIPC)High incomeHondurasHong Kong SAR, ChinaHungaryIBRD onlyIcelandIDA & IBRD totalIDA blendIDA onlyIDA totalIndiaIndonesiaIran, Islamic Rep.IraqIrelandIsraelItalyJamaicaJapanJordanKazakhstanKenyaKiribatiKorea, Dem. People’s Rep.Korea, Rep.KosovoKuwaitKyrgyz RepublicLao PDRLate-demographic dividendLatin America & Caribbean Latin America & Caribbean (excluding high income)Latin America & the Caribbean (IDA & IBRD countries)LatviaLeast developed countries: UN classificationLebanonLiberiaLibyaLithuaniaLow & middle incomeLow incomeLower middle incomeLuxembourgMacao SAR, ChinaMacedonia, FYRMadagascarMalawiMalaysiaMaldivesMaliMaltaMauritaniaMauritiusMexicoMiddle East & North AfricaMiddle East & North Africa (excluding high income)Middle East & North Africa (IDA & IBRD countries)Middle incomeMoldovaMongoliaMontenegroMoroccoMozambiqueMyanmarNauruNepalNetherlandsNew CaledoniaNew ZealandNicaraguaNigerNigeriaNorth AmericaNorwayOECD membersOmanOther small statesPacific island small statesPakistanPanamaPapua New GuineaParaguayPeruPhilippinesPolandPortugalPost-demographic dividendPre-demographic dividendQatarRomaniaRussian FederationRwandaSamoaSao Tome and PrincipeSaudi ArabiaSenegalSerbiaSeychellesSierra LeoneSingaporeSlovak RepublicSloveniaSmall statesSolomon IslandsSomaliaSouth AfricaSouth AsiaSouth Asia (IDA & IBRD)SpainSri LankaSt. Kitts and NevisSt. LuciaSt. Vincent and the GrenadinesSub-Saharan Africa Sub-Saharan Africa (excluding high income)Sub-Saharan Africa (IDA & IBRD countries)SudanSurinameSwedenSwitzerlandSyrian Arab RepublicTajikistanTanzaniaThailandTogoTongaTrinidad and TobagoTunisiaTurkeyTurkmenistanTuvaluUgandaUkraineUnited Arab EmiratesUnited KingdomUnited StatesUpper middle incomeUruguayUzbekistanVanuatuVenezuela, RBVietnamWorldYemen, Rep.ZambiaZimbabwe Timeline:
This timeline shows a graph from 1963 to 2015 of Bahamas, The. No data until 1962. Number of actual observations by date: 53.
Source name:
World Development Indicators
Source organization:
World Bank staff estimates based data from International Monetary Fund's Direction of Trade database.
Categories, topics:
Private Sector, Trade
Last updated:
apr 23, 2017
Indicators value changes by year
Minimum:
26.711
jan 1, 2014
At the date of observation
Value
Absolute change
Change from previous value
jan 1, 1963
100.0
+100.0
0.0%
jan 1, 1964
98.958
-1.042
-1.04%
jan 1, 1965
98.726
-0.232
-0.23%
jan 1, 1966
97.297
-1.429
-1.45%
jan 1, 1967
98.174
+0.876
0.9%
jan 1, 1968
96.11
-2.063
-2.1%
jan 1, 1969
92.885
-3.225
-3.36%
jan 1, 1970
94.181
+1.295
1.39%
jan 1, 1971
95.213
+1.032
1.1%
jan 1, 1972
97.369
+2.156
2.26%
jan 1, 1973
98.293
+0.924
0.95%
jan 1, 1974
97.182
-1.112
-1.13%
jan 1, 1975
95.725
-1.456
-1.5%
jan 1, 1976
90.437
-5.288
-5.52%
jan 1, 1977
98.539
+8.102
8.96%
jan 1, 1978
96.135
-2.404
-2.44%
jan 1, 1979
97.073
+0.939
0.98%
jan 1, 1980
97.523
+0.45
0.46%
jan 1, 1981
89.701
-7.821
-8.02%
jan 1, 1982
95.932
+6.231
6.95%
jan 1, 1983
97.589
+1.657
1.73%
jan 1, 1984
97.37
-0.22
-0.23%
jan 1, 1985
97.647
+0.277
0.28%
jan 1, 1986
96.259
-1.388
-1.42%
jan 1, 1987
98.612
+2.353
2.44%
jan 1, 1988
97.743
-0.868
-0.88%
jan 1, 1989
97.304
-0.439
-0.45%
jan 1, 1990
97.799
+0.495
0.51%
jan 1, 1991
96.654
-1.145
-1.17%
jan 1, 1992
97.01
+0.356
0.37%
jan 1, 1993
93.109
-3.901
-4.02%
jan 1, 1994
89.162
-3.947
-4.24%
jan 1, 1995
92.546
+3.383
3.79%
jan 1, 1996
86.812
-5.733
-6.19%
jan 1, 1997
89.229
+2.417
2.78%
jan 1, 1998
96.208
+6.979
7.82%
jan 1, 1999
91.072
-5.136
-5.34%
jan 1, 2000
91.114
+0.041
0.05%
jan 1, 2001
91.52
+0.406
0.45%
jan 1, 2002
90.129
-1.39
-1.52%
jan 1, 2003
78.256
-11.873
-13.17%
jan 1, 2004
76.476
-1.78
-2.27%
jan 1, 2005
87.105
+10.629
13.9%
jan 1, 2006
91.39
+4.285
4.92%
jan 1, 2007
93.622
+2.232
2.44%
jan 1, 2008
89.794
-3.828
-4.09%
jan 1, 2009
83.942
-5.851
-6.52%
jan 1, 2010
82.887
-1.055
-1.26%
jan 1, 2011
63.777
-19.11
-23.06%
jan 1, 2012
72.251
+8.474
13.29%
jan 1, 2013
60.56
-11.691
-16.18%
jan 1, 2014
26.711
-33.849
-55.89%
jan 1, 2015
29.617
+2.906
10.88%
Ranking of countries by current statistics by years


Comments: