29
/
en
AIzaSyAYiBZKx7MnpbEhh9jyipgxe19OcubqV5w
April 1, 2024
52042
North America
NAC
false
2
1
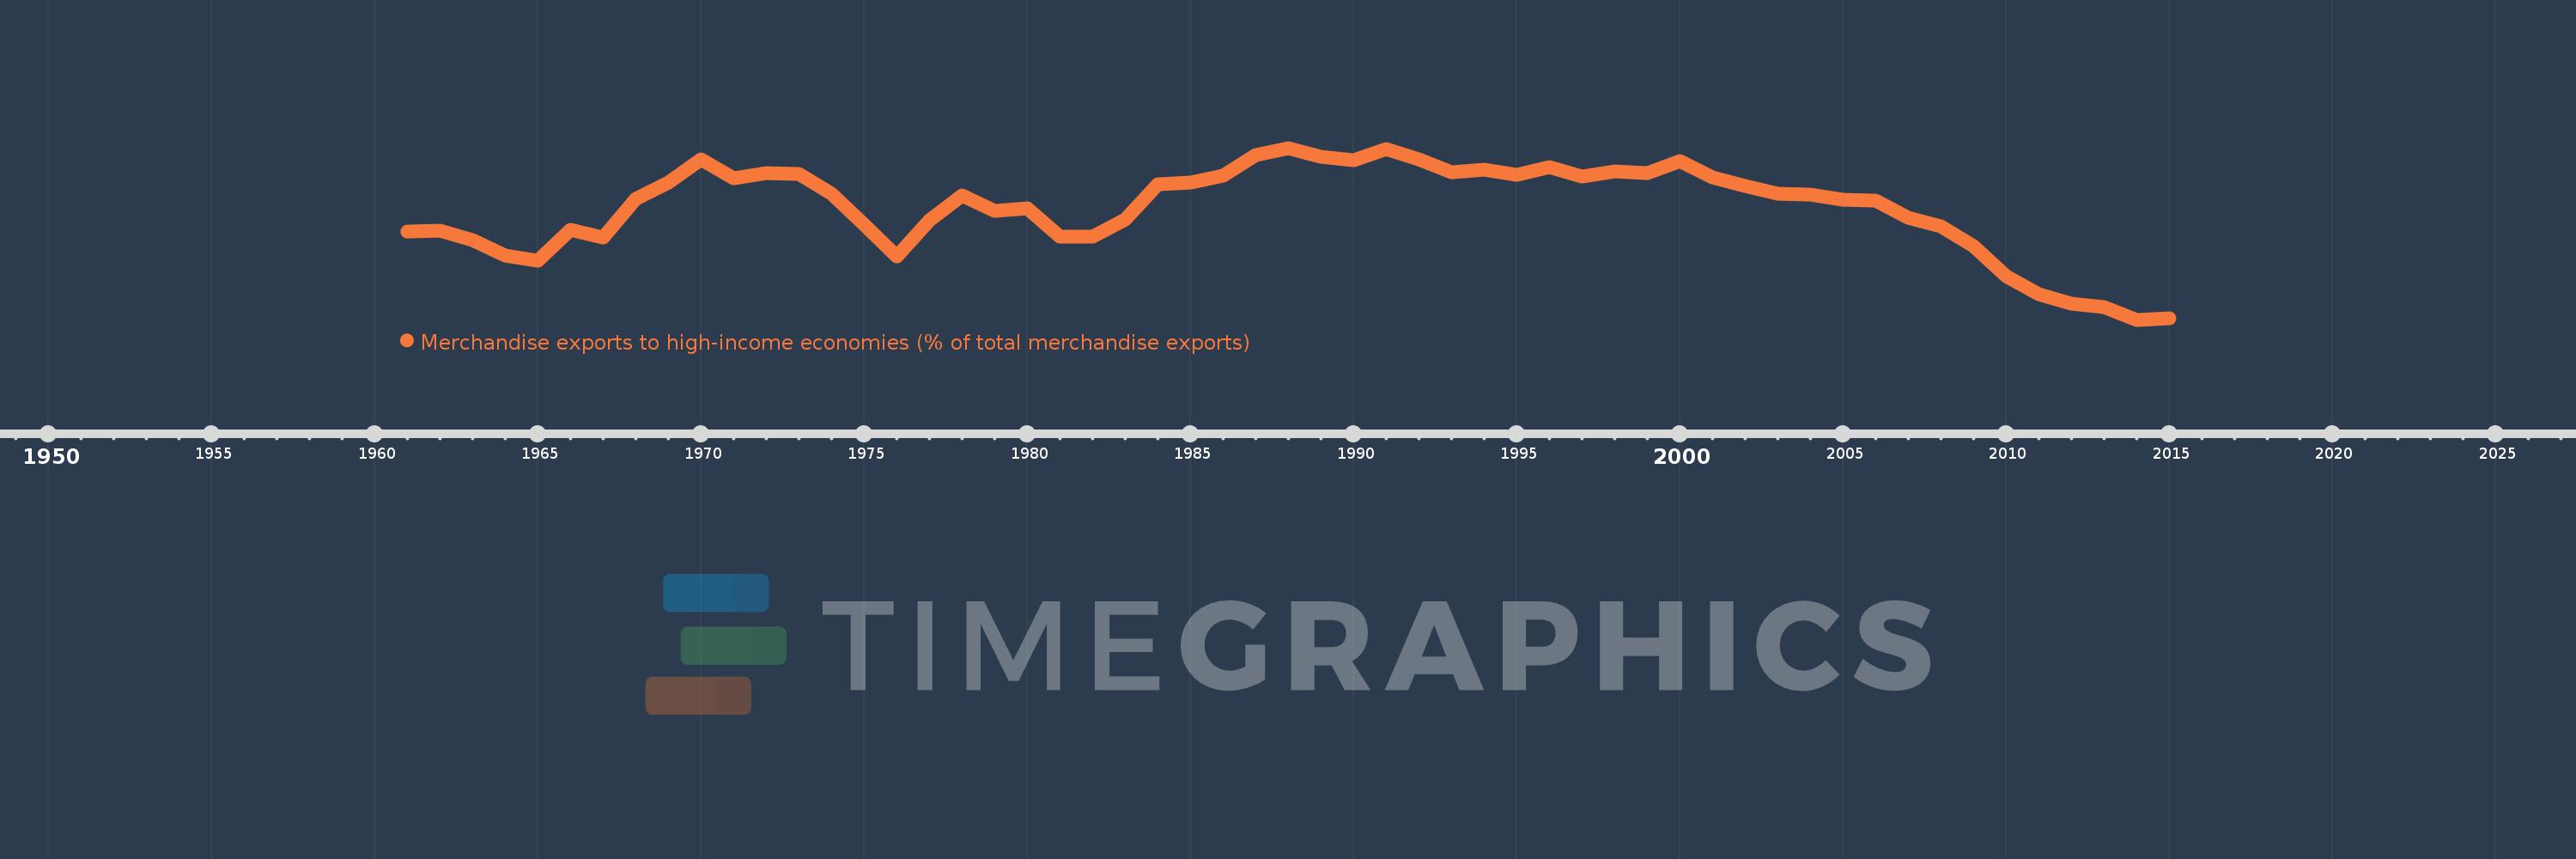
Merchandise exports to high-income economies (% of total merchandise exports)
2015,2014,2013,2012,2011,2010,2009,2008,2007,2006,2005,2004,2003,2002,2001,2000,1999,1998,1997,1996,1995,1994,1993,1992,1991,1990,1989,1988,1987,1986,1985,1984,1983,1982,1981,1980,1979,1978,1977,1976,1975,1974,1973,1972,1971,1970,1969,1968,1967,1966,1965,1964,1963,1962,1961
This statistics in other country:
AfghanistanAlbaniaAlgeriaAmerican SamoaAngolaAntigua and BarbudaArab WorldArgentinaArmeniaArubaAustraliaAustriaAzerbaijanBahamas, TheBahrainBangladeshBarbadosBelarusBelgiumBelizeBeninBermudaBoliviaBosnia and HerzegovinaBrazilBrunei DarussalamBulgariaBurkina FasoBurundiCabo VerdeCambodiaCameroonCanadaCaribbean small statesCentral African RepublicCentral Europe and the BalticsChadChileChinaColombiaComorosCongo, Dem. Rep.Congo, Rep.Costa RicaCote d'IvoireCroatiaCubaCyprusCzech RepublicDenmarkDjiboutiDominicaDominican RepublicEarly-demographic dividendEast Asia & PacificEast Asia & Pacific (excluding high income)East Asia & Pacific (IDA & IBRD countries)EcuadorEgypt, Arab Rep.El SalvadorEquatorial GuineaEstoniaEthiopiaEuro areaEurope & Central AsiaEurope & Central Asia (excluding high income)Europe & Central Asia (IDA & IBRD countries)European UnionFaroe IslandsFijiFinlandFragile and conflict affected situationsFranceFrench PolynesiaGabonGambia, TheGeorgiaGermanyGhanaGibraltarGreeceGreenlandGrenadaGuamGuatemalaGuineaGuinea-BissauGuyanaHaitiHeavily indebted poor countries (HIPC)High incomeHondurasHong Kong SAR, ChinaHungaryIBRD onlyIcelandIDA & IBRD totalIDA blendIDA onlyIDA totalIndiaIndonesiaIran, Islamic Rep.IraqIrelandIsraelItalyJamaicaJapanJordanKazakhstanKenyaKiribatiKorea, Dem. People’s Rep.Korea, Rep.KosovoKuwaitKyrgyz RepublicLao PDRLate-demographic dividendLatin America & Caribbean Latin America & Caribbean (excluding high income)Latin America & the Caribbean (IDA & IBRD countries)LatviaLeast developed countries: UN classificationLebanonLiberiaLibyaLithuaniaLow & middle incomeLow incomeLower middle incomeLuxembourgMacao SAR, ChinaMacedonia, FYRMadagascarMalawiMalaysiaMaldivesMaliMaltaMauritaniaMauritiusMexicoMiddle East & North AfricaMiddle East & North Africa (excluding high income)Middle East & North Africa (IDA & IBRD countries)Middle incomeMoldovaMongoliaMontenegroMoroccoMozambiqueMyanmarNauruNepalNetherlandsNew CaledoniaNew ZealandNicaraguaNigerNigeriaNorth AmericaNorwayOECD membersOmanOther small statesPacific island small statesPakistanPanamaPapua New GuineaParaguayPeruPhilippinesPolandPortugalPost-demographic dividendPre-demographic dividendQatarRomaniaRussian FederationRwandaSamoaSao Tome and PrincipeSaudi ArabiaSenegalSerbiaSeychellesSierra LeoneSingaporeSlovak RepublicSloveniaSmall statesSolomon IslandsSomaliaSouth AfricaSouth AsiaSouth Asia (IDA & IBRD)SpainSri LankaSt. Kitts and NevisSt. LuciaSt. Vincent and the GrenadinesSub-Saharan Africa Sub-Saharan Africa (excluding high income)Sub-Saharan Africa (IDA & IBRD countries)SudanSurinameSwedenSwitzerlandSyrian Arab RepublicTajikistanTanzaniaThailandTogoTongaTrinidad and TobagoTunisiaTurkeyTurkmenistanTuvaluUgandaUkraineUnited Arab EmiratesUnited KingdomUnited StatesUpper middle incomeUruguayUzbekistanVanuatuVenezuela, RBVietnamWorldYemen, Rep.ZambiaZimbabwe Timeline:
This timeline shows a graph from 1961 to 2015 of North America. No data until 1960. Number of actual observations by date: 55.
Source name:
World Development Indicators
Source organization:
World Bank staff estimates based data from International Monetary Fund's Direction of Trade database.
Categories, topics:
Private Sector, Trade
Last updated:
apr 23, 2017
Indicators value changes by year
Minimum:
67.518
jan 1, 2014
Maximum:
80.655
jan 1, 1988
At the date of observation
Value
Absolute change
Change from previous value
jan 1, 1961
74.266
+74.266
0.0%
jan 1, 1962
74.331
+0.065
0.09%
jan 1, 1963
73.584
-0.747
-1.01%
jan 1, 1964
72.44
-1.144
-1.55%
jan 1, 1965
72.044
-0.396
-0.55%
jan 1, 1966
74.426
+2.382
3.31%
jan 1, 1967
73.78
-0.646
-0.87%
jan 1, 1968
76.778
+2.998
4.06%
jan 1, 1969
78.029
+1.252
1.63%
jan 1, 1970
79.768
+1.739
2.23%
jan 1, 1971
78.36
-1.408
-1.77%
jan 1, 1972
78.698
+0.338
0.43%
jan 1, 1973
78.686
-0.012
-0.02%
jan 1, 1974
77.143
-1.543
-1.96%
jan 1, 1975
74.817
-2.326
-3.01%
jan 1, 1976
72.358
-2.459
-3.29%
jan 1, 1977
75.118
+2.76
3.81%
jan 1, 1978
77.004
+1.886
2.51%
jan 1, 1979
75.813
-1.192
-1.55%
jan 1, 1980
76.059
+0.246
0.32%
jan 1, 1981
73.901
-2.158
-2.84%
jan 1, 1982
73.854
-0.047
-0.06%
jan 1, 1983
75.166
+1.312
1.78%
jan 1, 1984
77.89
+2.724
3.62%
jan 1, 1985
77.985
+0.095
0.12%
jan 1, 1986
78.56
+0.575
0.74%
jan 1, 1987
80.134
+1.574
2.0%
jan 1, 1988
80.655
+0.521
0.65%
jan 1, 1989
80.011
-0.644
-0.8%
jan 1, 1990
79.735
-0.276
-0.35%
jan 1, 1991
80.556
+0.821
1.03%
jan 1, 1992
79.765
-0.791
-0.98%
jan 1, 1993
78.779
-0.986
-1.24%
jan 1, 1994
78.972
+0.193
0.24%
jan 1, 1995
78.599
-0.373
-0.47%
jan 1, 1996
79.16
+0.562
0.71%
jan 1, 1997
78.487
-0.673
-0.85%
jan 1, 1998
78.887
+0.399
0.51%
jan 1, 1999
78.707
-0.18
-0.23%
jan 1, 2000
79.663
+0.956
1.21%
jan 1, 2001
78.37
-1.293
-1.62%
jan 1, 2002
77.732
-0.638
-0.81%
jan 1, 2003
77.167
-0.565
-0.73%
jan 1, 2004
77.068
-0.099
-0.13%
jan 1, 2005
76.688
-0.38
-0.49%
jan 1, 2006
76.632
-0.056
-0.07%
jan 1, 2007
75.344
-1.288
-1.68%
jan 1, 2008
74.649
-0.695
-0.92%
jan 1, 2009
73.164
-1.485
-1.99%
jan 1, 2010
70.856
-2.307
-3.15%
jan 1, 2011
69.471
-1.386
-1.96%
jan 1, 2012
68.776
-0.695
-1.0%
jan 1, 2013
68.452
-0.324
-0.47%
jan 1, 2014
67.518
-0.934
-1.36%
jan 1, 2015
67.613
+0.095
0.14%
Ranking of countries by current statistics by years


Comments: