29
/
en
AIzaSyAYiBZKx7MnpbEhh9jyipgxe19OcubqV5w
April 1, 2024
258576
Syrian Arab Republic
SYR
true
2
1
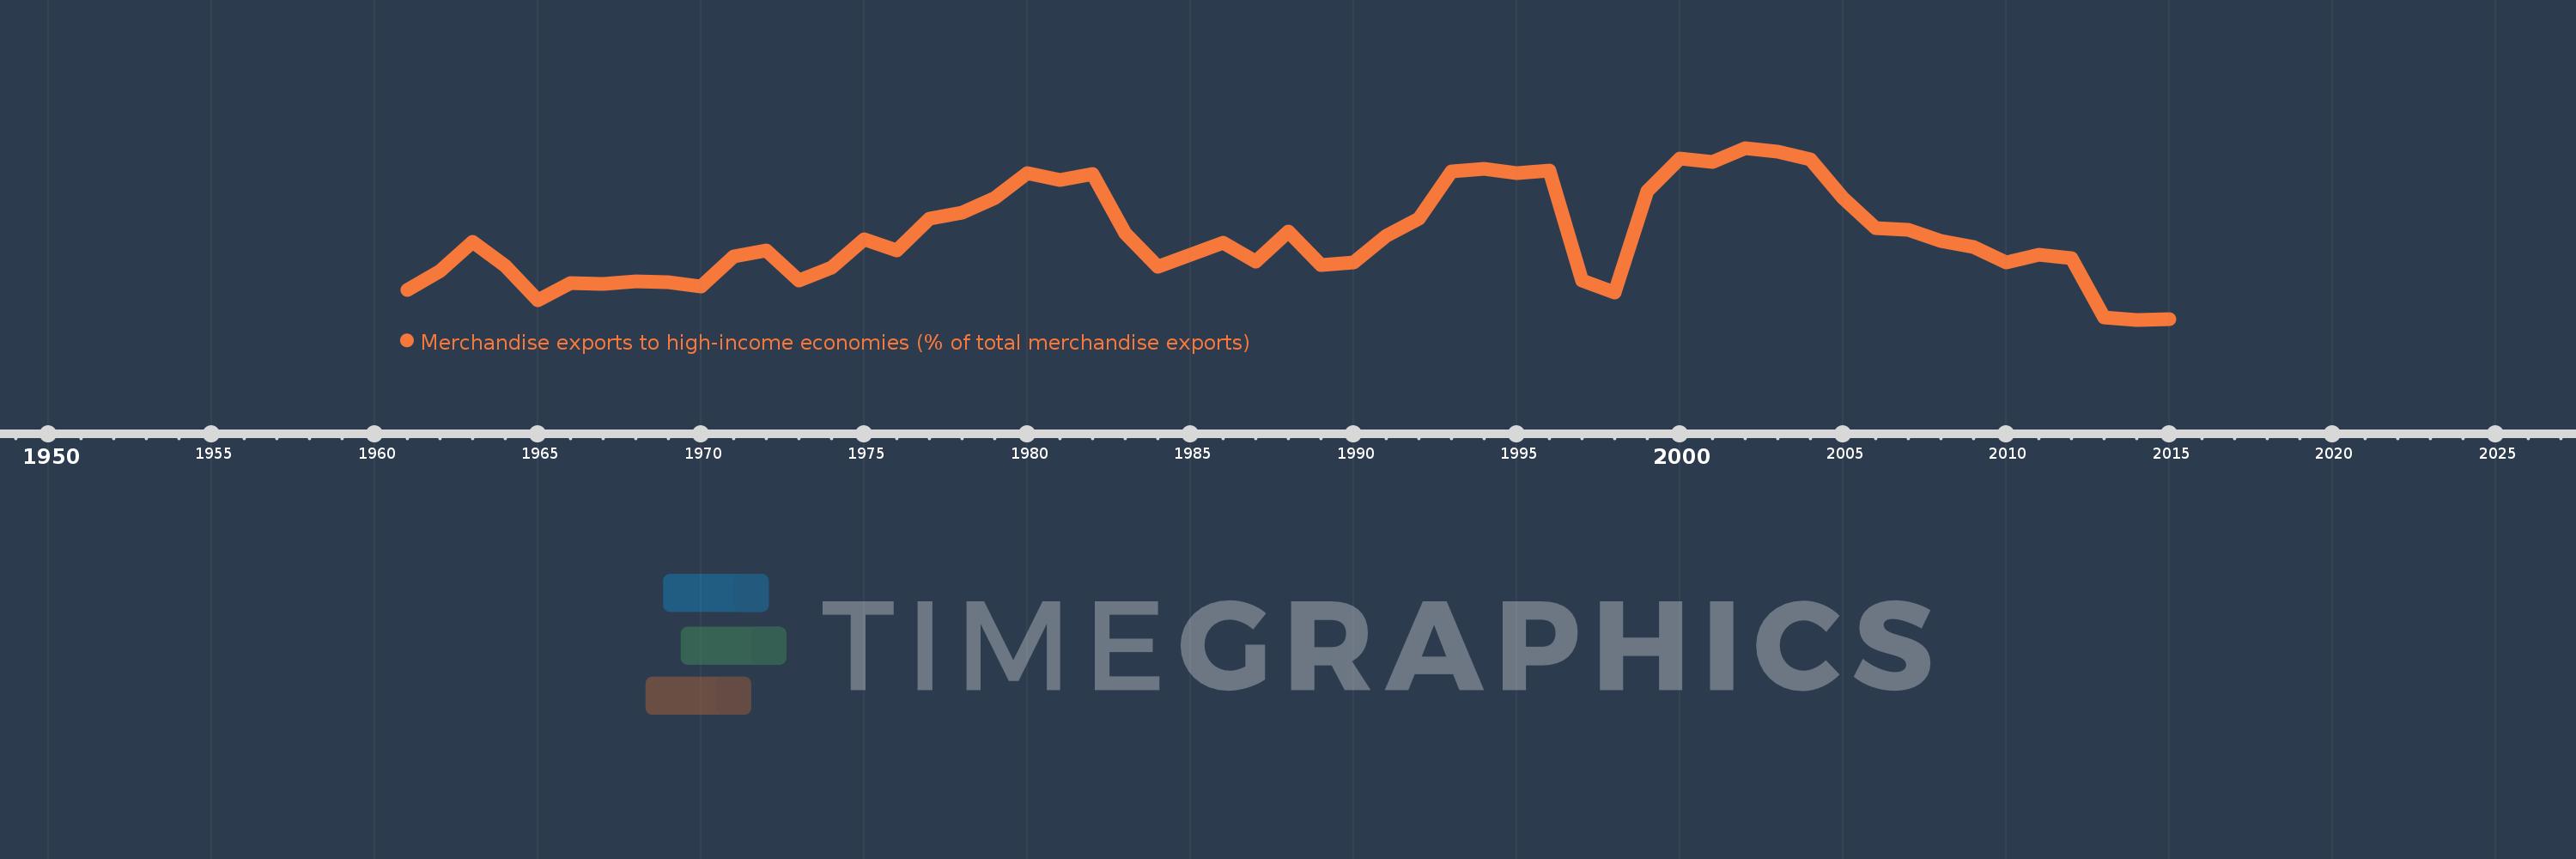
Merchandise exports to high-income economies (% of total merchandise exports)
2015,2014,2013,2012,2011,2010,2009,2008,2007,2006,2005,2004,2003,2002,2001,2000,1999,1998,1997,1996,1995,1994,1993,1992,1991,1990,1989,1988,1987,1986,1985,1984,1983,1982,1981,1980,1979,1978,1977,1976,1975,1974,1973,1972,1971,1970,1969,1968,1967,1966,1965,1964,1963,1962,1961
This statistics in other country:
AfghanistanAlbaniaAlgeriaAmerican SamoaAngolaAntigua and BarbudaArab WorldArgentinaArmeniaArubaAustraliaAustriaAzerbaijanBahamas, TheBahrainBangladeshBarbadosBelarusBelgiumBelizeBeninBermudaBoliviaBosnia and HerzegovinaBrazilBrunei DarussalamBulgariaBurkina FasoBurundiCabo VerdeCambodiaCameroonCanadaCaribbean small statesCentral African RepublicCentral Europe and the BalticsChadChileChinaColombiaComorosCongo, Dem. Rep.Congo, Rep.Costa RicaCote d'IvoireCroatiaCubaCyprusCzech RepublicDenmarkDjiboutiDominicaDominican RepublicEarly-demographic dividendEast Asia & PacificEast Asia & Pacific (excluding high income)East Asia & Pacific (IDA & IBRD countries)EcuadorEgypt, Arab Rep.El SalvadorEquatorial GuineaEstoniaEthiopiaEuro areaEurope & Central AsiaEurope & Central Asia (excluding high income)Europe & Central Asia (IDA & IBRD countries)European UnionFaroe IslandsFijiFinlandFragile and conflict affected situationsFranceFrench PolynesiaGabonGambia, TheGeorgiaGermanyGhanaGibraltarGreeceGreenlandGrenadaGuamGuatemalaGuineaGuinea-BissauGuyanaHaitiHeavily indebted poor countries (HIPC)High incomeHondurasHong Kong SAR, ChinaHungaryIBRD onlyIcelandIDA & IBRD totalIDA blendIDA onlyIDA totalIndiaIndonesiaIran, Islamic Rep.IraqIrelandIsraelItalyJamaicaJapanJordanKazakhstanKenyaKiribatiKorea, Dem. People’s Rep.Korea, Rep.KosovoKuwaitKyrgyz RepublicLao PDRLate-demographic dividendLatin America & Caribbean Latin America & Caribbean (excluding high income)Latin America & the Caribbean (IDA & IBRD countries)LatviaLeast developed countries: UN classificationLebanonLiberiaLibyaLithuaniaLow & middle incomeLow incomeLower middle incomeLuxembourgMacao SAR, ChinaMacedonia, FYRMadagascarMalawiMalaysiaMaldivesMaliMaltaMauritaniaMauritiusMexicoMiddle East & North AfricaMiddle East & North Africa (excluding high income)Middle East & North Africa (IDA & IBRD countries)Middle incomeMoldovaMongoliaMontenegroMoroccoMozambiqueMyanmarNauruNepalNetherlandsNew CaledoniaNew ZealandNicaraguaNigerNigeriaNorth AmericaNorwayOECD membersOmanOther small statesPacific island small statesPakistanPanamaPapua New GuineaParaguayPeruPhilippinesPolandPortugalPost-demographic dividendPre-demographic dividendQatarRomaniaRussian FederationRwandaSamoaSao Tome and PrincipeSaudi ArabiaSenegalSerbiaSeychellesSierra LeoneSingaporeSlovak RepublicSloveniaSmall statesSolomon IslandsSomaliaSouth AfricaSouth AsiaSouth Asia (IDA & IBRD)SpainSri LankaSt. Kitts and NevisSt. LuciaSt. Vincent and the GrenadinesSub-Saharan Africa Sub-Saharan Africa (excluding high income)Sub-Saharan Africa (IDA & IBRD countries)SudanSurinameSwedenSwitzerlandSyrian Arab RepublicTajikistanTanzaniaThailandTogoTongaTrinidad and TobagoTunisiaTurkeyTurkmenistanTuvaluUgandaUkraineUnited Arab EmiratesUnited KingdomUnited StatesUpper middle incomeUruguayUzbekistanVanuatuVenezuela, RBVietnamWorldYemen, Rep.ZambiaZimbabwe Timeline:
This timeline shows a graph from 1961 to 2015 of Syrian Arab Republic. No data until 1960. Number of actual observations by date: 55.
Source name:
World Development Indicators
Source organization:
World Bank staff estimates based data from International Monetary Fund's Direction of Trade database.
Categories, topics:
Private Sector, Trade
Last updated:
apr 23, 2017
Indicators value changes by year
Minimum:
25.332
jan 1, 2014
Maximum:
80.731
jan 1, 2002
At the date of observation
Value
Absolute change
Change from previous value
jan 1, 1961
35.061
+35.061
0.0%
jan 1, 1962
40.905
+5.844
16.67%
jan 1, 1963
50.478
+9.573
23.4%
jan 1, 1964
42.713
-7.765
-15.38%
jan 1, 1965
31.743
-10.97
-25.68%
jan 1, 1966
37.167
+5.423
17.08%
jan 1, 1967
36.873
-0.293
-0.79%
jan 1, 1968
37.75
+0.877
2.38%
jan 1, 1969
37.373
-0.377
-1.0%
jan 1, 1970
36.005
-1.368
-3.66%
jan 1, 1971
45.67
+9.665
26.84%
jan 1, 1972
47.713
+2.044
4.48%
jan 1, 1973
37.862
-9.851
-20.65%
jan 1, 1974
42.019
+4.157
10.98%
jan 1, 1975
51.263
+9.244
22.0%
jan 1, 1976
47.619
-3.644
-7.11%
jan 1, 1977
58.05
+10.432
21.91%
jan 1, 1978
59.914
+1.864
3.21%
jan 1, 1979
64.523
+4.608
7.69%
jan 1, 1980
72.684
+8.162
12.65%
jan 1, 1981
70.512
-2.172
-2.99%
jan 1, 1982
72.472
+1.96
2.78%
jan 1, 1983
53.187
-19.285
-26.61%
jan 1, 1984
42.366
-10.821
-20.34%
jan 1, 1985
46.413
+4.047
9.55%
jan 1, 1986
50.093
+3.679
7.93%
jan 1, 1987
44.11
-5.982
-11.94%
jan 1, 1988
53.755
+9.645
21.87%
jan 1, 1989
42.945
-10.81
-20.11%
jan 1, 1990
43.779
+0.834
1.94%
jan 1, 1991
52.311
+8.532
19.49%
jan 1, 1992
57.798
+5.487
10.49%
jan 1, 1993
73.298
+15.5
26.82%
jan 1, 1994
73.972
+0.674
0.92%
jan 1, 1995
72.547
-1.425
-1.93%
jan 1, 1996
73.435
+0.888
1.22%
jan 1, 1997
38.012
-35.423
-48.24%
jan 1, 1998
34.213
-3.799
-10.0%
jan 1, 1999
66.837
+32.624
95.36%
jan 1, 2000
77.46
+10.622
15.89%
jan 1, 2001
76.125
-1.334
-1.72%
jan 1, 2002
80.731
+4.606
6.05%
jan 1, 2003
79.574
-1.157
-1.43%
jan 1, 2004
76.909
-2.665
-3.35%
jan 1, 2005
64.665
-12.243
-15.92%
jan 1, 2006
54.843
-9.823
-15.19%
jan 1, 2007
54.333
-0.509
-0.93%
jan 1, 2008
50.748
-3.585
-6.6%
jan 1, 2009
48.754
-1.995
-3.93%
jan 1, 2010
43.725
-5.029
-10.31%
jan 1, 2011
46.23
+2.505
5.73%
jan 1, 2012
45.147
-1.083
-2.34%
jan 1, 2013
26.051
-19.096
-42.3%
jan 1, 2014
25.332
-0.719
-2.76%
jan 1, 2015
25.601
+0.269
1.06%
Ranking of countries by current statistics by years


Comments: