29
/
en
AIzaSyAYiBZKx7MnpbEhh9jyipgxe19OcubqV5w
April 1, 2024
153782
Iceland
ISL
true
2
1
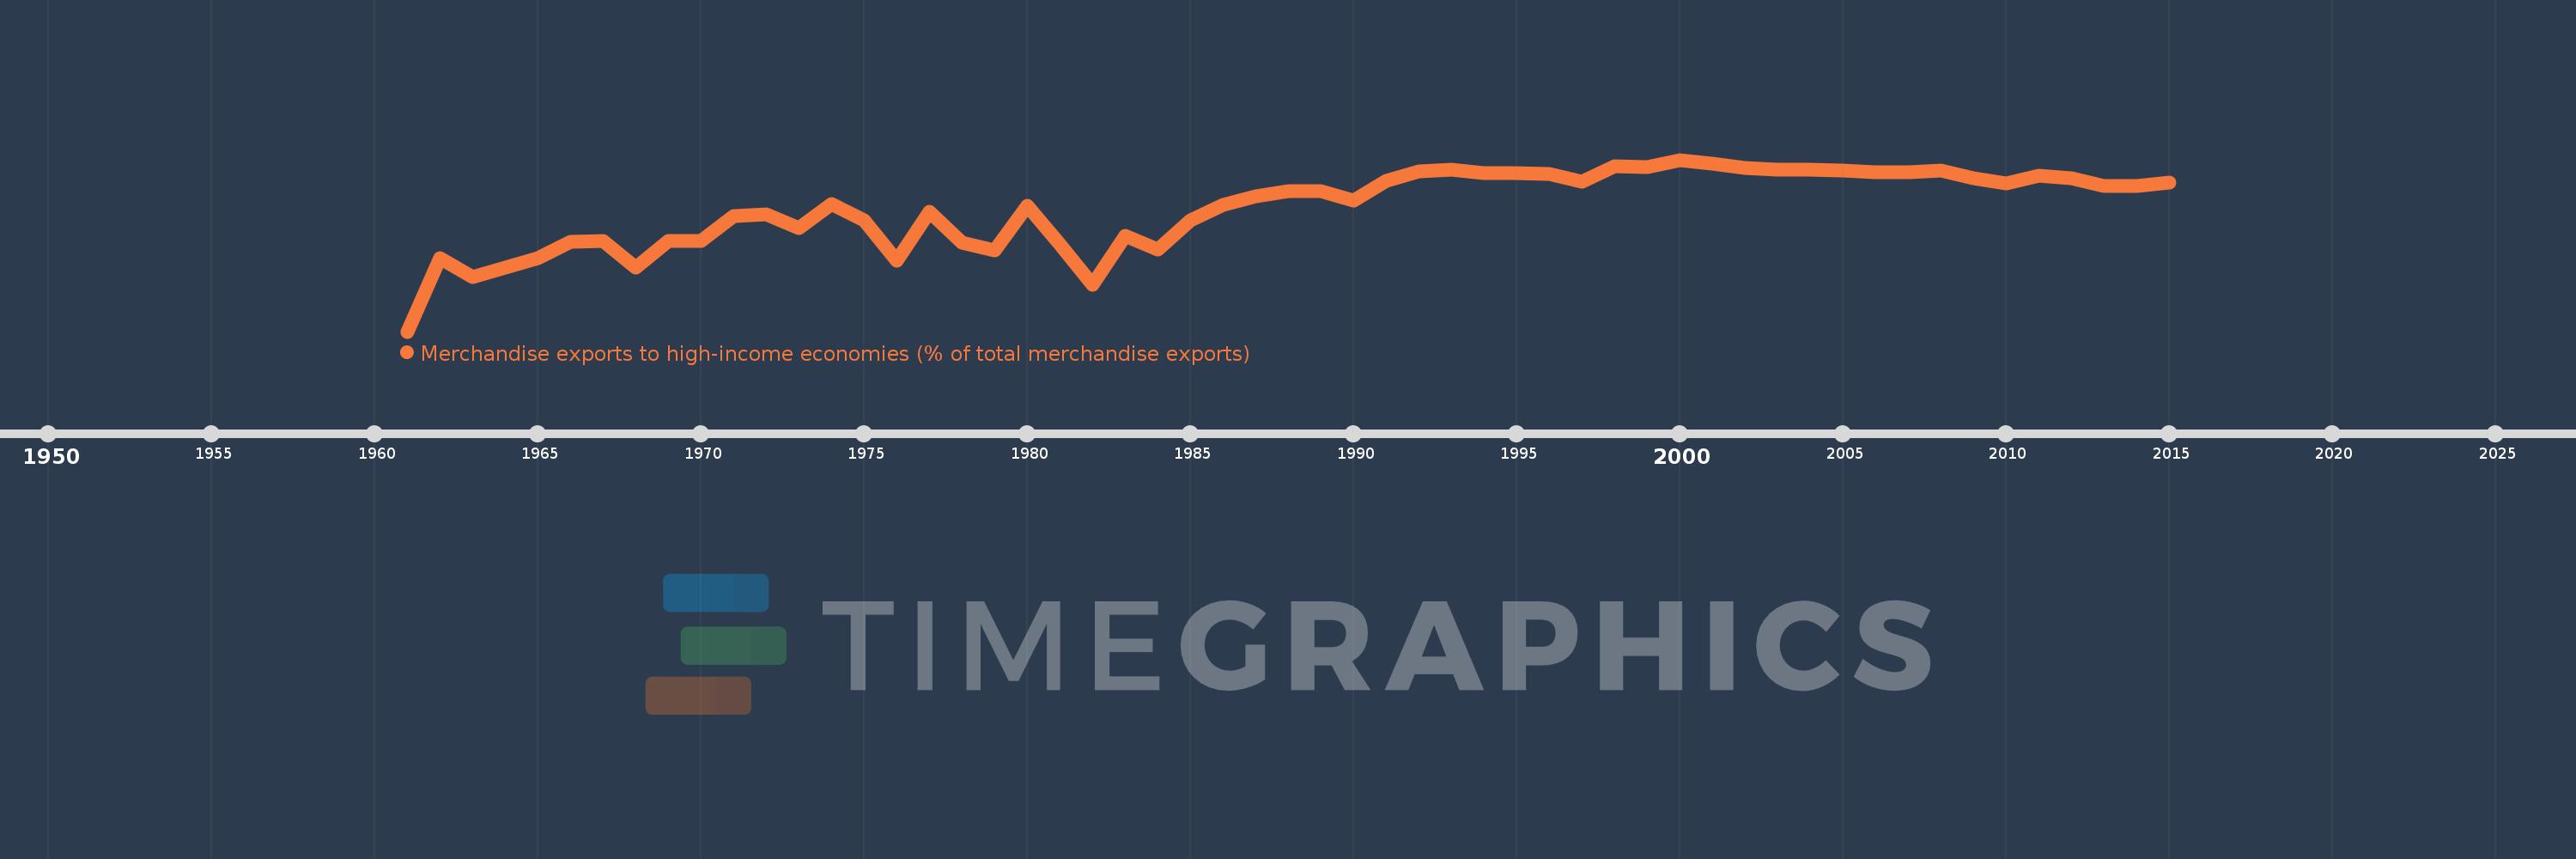
Merchandise exports to high-income economies (% of total merchandise exports)
2015,2014,2013,2012,2011,2010,2009,2008,2007,2006,2005,2004,2003,2002,2001,2000,1999,1998,1997,1996,1995,1994,1993,1992,1991,1990,1989,1988,1987,1986,1985,1984,1983,1982,1981,1980,1979,1978,1977,1976,1975,1974,1973,1972,1971,1970,1969,1968,1967,1966,1965,1964,1963,1962,1961
This statistics in other country:
AfghanistanAlbaniaAlgeriaAmerican SamoaAngolaAntigua and BarbudaArab WorldArgentinaArmeniaArubaAustraliaAustriaAzerbaijanBahamas, TheBahrainBangladeshBarbadosBelarusBelgiumBelizeBeninBermudaBoliviaBosnia and HerzegovinaBrazilBrunei DarussalamBulgariaBurkina FasoBurundiCabo VerdeCambodiaCameroonCanadaCaribbean small statesCentral African RepublicCentral Europe and the BalticsChadChileChinaColombiaComorosCongo, Dem. Rep.Congo, Rep.Costa RicaCote d'IvoireCroatiaCubaCyprusCzech RepublicDenmarkDjiboutiDominicaDominican RepublicEarly-demographic dividendEast Asia & PacificEast Asia & Pacific (excluding high income)East Asia & Pacific (IDA & IBRD countries)EcuadorEgypt, Arab Rep.El SalvadorEquatorial GuineaEstoniaEthiopiaEuro areaEurope & Central AsiaEurope & Central Asia (excluding high income)Europe & Central Asia (IDA & IBRD countries)European UnionFaroe IslandsFijiFinlandFragile and conflict affected situationsFranceFrench PolynesiaGabonGambia, TheGeorgiaGermanyGhanaGibraltarGreeceGreenlandGrenadaGuamGuatemalaGuineaGuinea-BissauGuyanaHaitiHeavily indebted poor countries (HIPC)High incomeHondurasHong Kong SAR, ChinaHungaryIBRD onlyIcelandIDA & IBRD totalIDA blendIDA onlyIDA totalIndiaIndonesiaIran, Islamic Rep.IraqIrelandIsraelItalyJamaicaJapanJordanKazakhstanKenyaKiribatiKorea, Dem. People’s Rep.Korea, Rep.KosovoKuwaitKyrgyz RepublicLao PDRLate-demographic dividendLatin America & Caribbean Latin America & Caribbean (excluding high income)Latin America & the Caribbean (IDA & IBRD countries)LatviaLeast developed countries: UN classificationLebanonLiberiaLibyaLithuaniaLow & middle incomeLow incomeLower middle incomeLuxembourgMacao SAR, ChinaMacedonia, FYRMadagascarMalawiMalaysiaMaldivesMaliMaltaMauritaniaMauritiusMexicoMiddle East & North AfricaMiddle East & North Africa (excluding high income)Middle East & North Africa (IDA & IBRD countries)Middle incomeMoldovaMongoliaMontenegroMoroccoMozambiqueMyanmarNauruNepalNetherlandsNew CaledoniaNew ZealandNicaraguaNigerNigeriaNorth AmericaNorwayOECD membersOmanOther small statesPacific island small statesPakistanPanamaPapua New GuineaParaguayPeruPhilippinesPolandPortugalPost-demographic dividendPre-demographic dividendQatarRomaniaRussian FederationRwandaSamoaSao Tome and PrincipeSaudi ArabiaSenegalSerbiaSeychellesSierra LeoneSingaporeSlovak RepublicSloveniaSmall statesSolomon IslandsSomaliaSouth AfricaSouth AsiaSouth Asia (IDA & IBRD)SpainSri LankaSt. Kitts and NevisSt. LuciaSt. Vincent and the GrenadinesSub-Saharan Africa Sub-Saharan Africa (excluding high income)Sub-Saharan Africa (IDA & IBRD countries)SudanSurinameSwedenSwitzerlandSyrian Arab RepublicTajikistanTanzaniaThailandTogoTongaTrinidad and TobagoTunisiaTurkeyTurkmenistanTuvaluUgandaUkraineUnited Arab EmiratesUnited KingdomUnited StatesUpper middle incomeUruguayUzbekistanVanuatuVenezuela, RBVietnamWorldYemen, Rep.ZambiaZimbabwe Timeline:
This timeline shows a graph from 1961 to 2015 of Iceland. No data until 1960. Number of actual observations by date: 55.
Source name:
World Development Indicators
Source organization:
World Bank staff estimates based data from International Monetary Fund's Direction of Trade database.
Categories, topics:
Private Sector, Trade
Last updated:
apr 23, 2017
Indicators value changes by year
Maximum:
98.543
jan 1, 2000
At the date of observation
Value
Absolute change
Change from previous value
jan 1, 1961
68.75
+68.75
0.0%
jan 1, 1962
81.445
+12.695
18.47%
jan 1, 1963
78.282
-3.163
-3.88%
jan 1, 1964
79.829
+1.548
1.98%
jan 1, 1965
81.441
+1.612
2.02%
jan 1, 1966
84.353
+2.912
3.58%
jan 1, 1967
84.522
+0.169
0.2%
jan 1, 1968
79.834
-4.688
-5.55%
jan 1, 1969
84.493
+4.66
5.84%
jan 1, 1970
84.492
-0.001
0.0%
jan 1, 1971
88.785
+4.293
5.08%
jan 1, 1972
89.119
+0.334
0.38%
jan 1, 1973
86.627
-2.492
-2.8%
jan 1, 1974
90.844
+4.217
4.87%
jan 1, 1975
88.074
-2.769
-3.05%
jan 1, 1976
81.059
-7.016
-7.97%
jan 1, 1977
89.584
+8.526
10.52%
jan 1, 1978
84.131
-5.454
-6.09%
jan 1, 1979
82.841
-1.289
-1.53%
jan 1, 1980
90.605
+7.764
9.37%
jan 1, 1981
83.841
-6.765
-7.47%
jan 1, 1982
76.86
-6.981
-8.33%
jan 1, 1983
85.291
+8.431
10.97%
jan 1, 1984
82.923
-2.368
-2.78%
jan 1, 1985
88.07
+5.147
6.21%
jan 1, 1986
90.775
+2.705
3.07%
jan 1, 1987
92.258
+1.483
1.63%
jan 1, 1988
93.038
+0.78
0.85%
jan 1, 1989
93.112
+0.074
0.08%
jan 1, 1990
91.413
-1.7
-1.83%
jan 1, 1991
94.92
+3.507
3.84%
jan 1, 1992
96.472
+1.553
1.64%
jan 1, 1993
96.811
+0.338
0.35%
jan 1, 1994
96.191
-0.619
-0.64%
jan 1, 1995
96.235
+0.044
0.05%
jan 1, 1996
96.072
-0.163
-0.17%
jan 1, 1997
94.68
-1.391
-1.45%
jan 1, 1998
97.403
+2.723
2.88%
jan 1, 1999
97.35
-0.054
-0.06%
jan 1, 2000
98.543
+1.194
1.23%
jan 1, 2001
97.928
-0.615
-0.62%
jan 1, 2002
97.174
-0.754
-0.77%
jan 1, 2003
96.777
-0.397
-0.41%
jan 1, 2004
96.861
+0.084
0.09%
jan 1, 2005
96.737
-0.124
-0.13%
jan 1, 2006
96.318
-0.419
-0.43%
jan 1, 2007
96.353
+0.035
0.04%
jan 1, 2008
96.636
+0.283
0.29%
jan 1, 2009
95.271
-1.366
-1.41%
jan 1, 2010
94.487
-0.783
-0.82%
jan 1, 2011
95.766
+1.278
1.35%
jan 1, 2012
95.41
-0.356
-0.37%
jan 1, 2013
94.006
-1.404
-1.47%
jan 1, 2014
94.007
+0.001
0.0%
jan 1, 2015
94.525
+0.518
0.55%
Ranking of countries by current statistics by years


Comments: