29
/
en
AIzaSyAYiBZKx7MnpbEhh9jyipgxe19OcubqV5w
April 1, 2024
204336
Myanmar
MMR
true
2
1
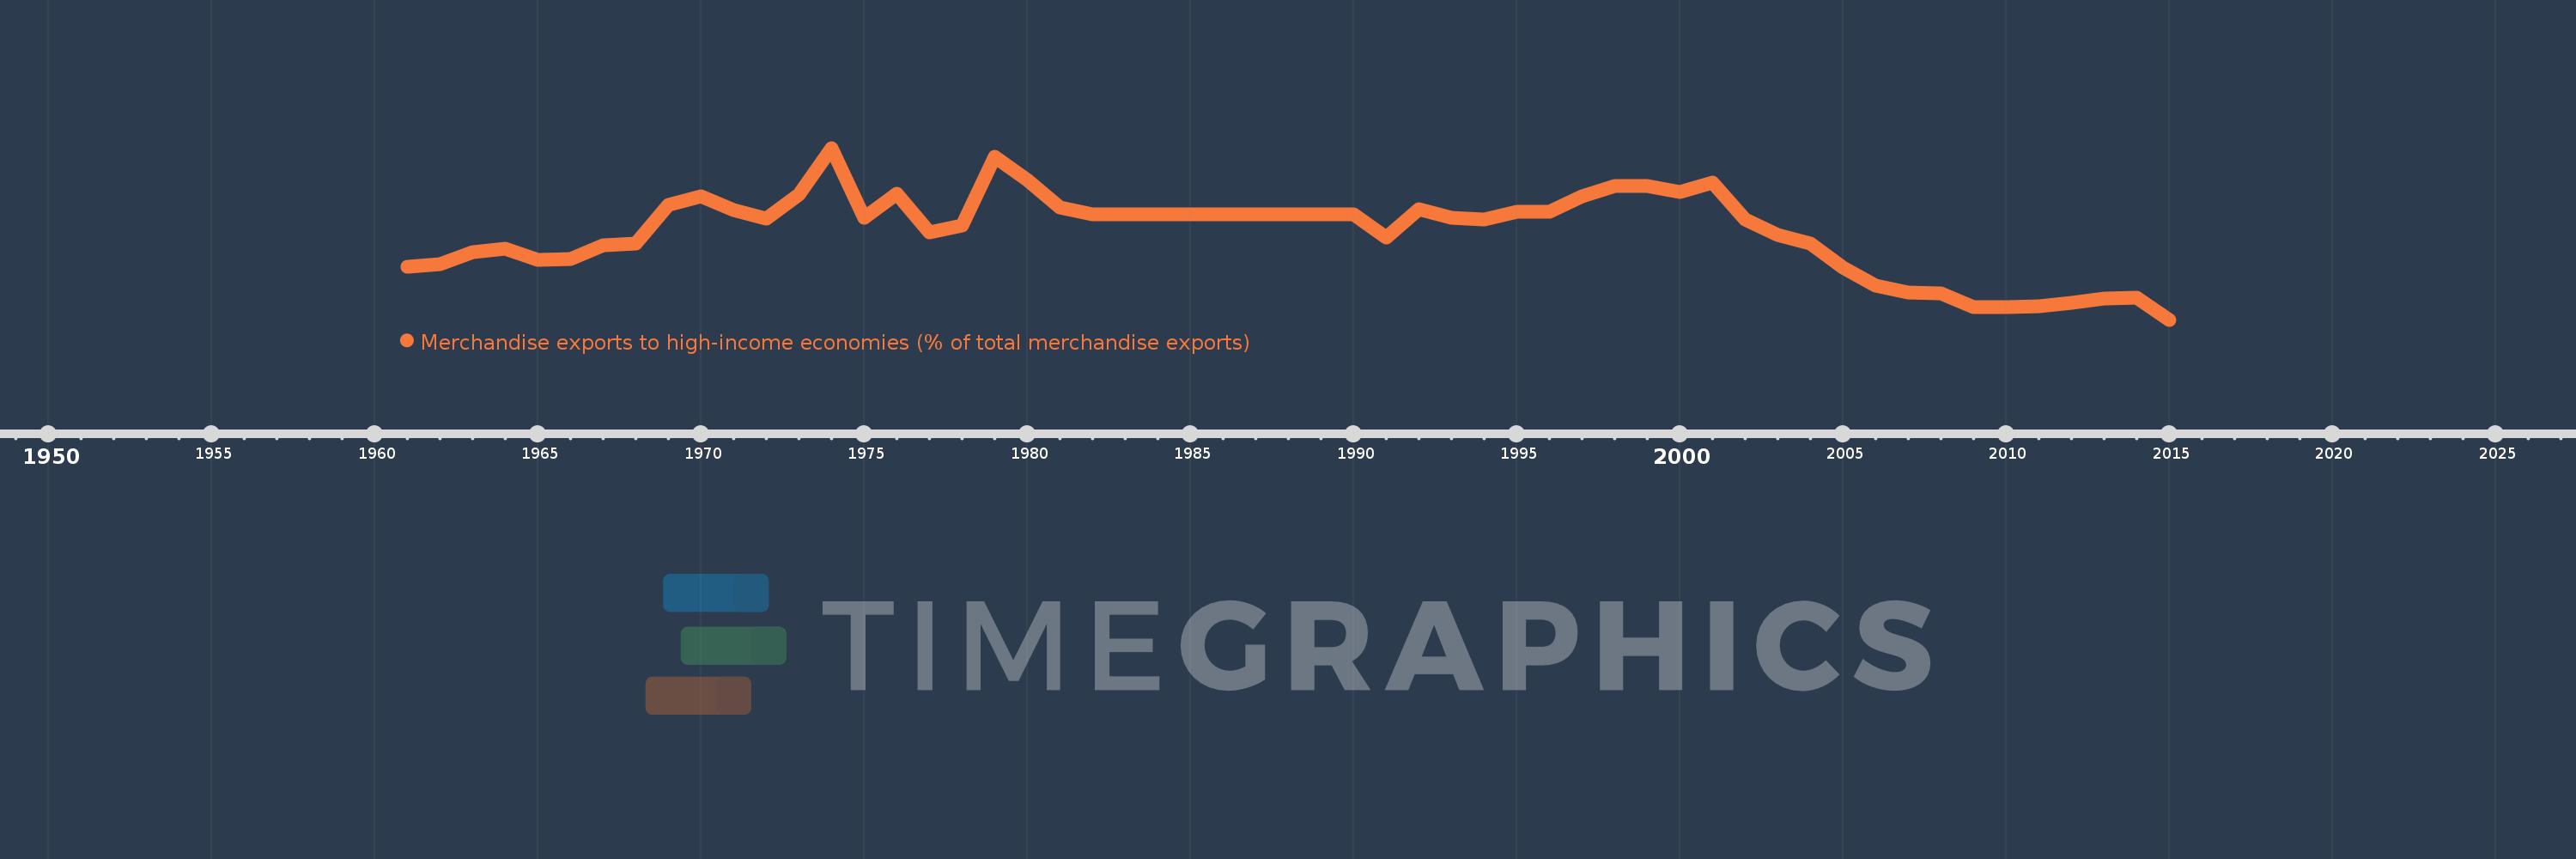
Merchandise exports to high-income economies (% of total merchandise exports)
2015,2014,2013,2012,2011,2010,2009,2008,2007,2006,2005,2004,2003,2002,2001,2000,1999,1998,1997,1996,1995,1994,1993,1992,1991,1990,1989,1988,1987,1986,1985,1984,1983,1982,1981,1980,1979,1978,1977,1976,1975,1974,1973,1972,1971,1970,1969,1968,1967,1966,1965,1964,1963,1962,1961
This statistics in other country:
AfghanistanAlbaniaAlgeriaAmerican SamoaAngolaAntigua and BarbudaArab WorldArgentinaArmeniaArubaAustraliaAustriaAzerbaijanBahamas, TheBahrainBangladeshBarbadosBelarusBelgiumBelizeBeninBermudaBoliviaBosnia and HerzegovinaBrazilBrunei DarussalamBulgariaBurkina FasoBurundiCabo VerdeCambodiaCameroonCanadaCaribbean small statesCentral African RepublicCentral Europe and the BalticsChadChileChinaColombiaComorosCongo, Dem. Rep.Congo, Rep.Costa RicaCote d'IvoireCroatiaCubaCyprusCzech RepublicDenmarkDjiboutiDominicaDominican RepublicEarly-demographic dividendEast Asia & PacificEast Asia & Pacific (excluding high income)East Asia & Pacific (IDA & IBRD countries)EcuadorEgypt, Arab Rep.El SalvadorEquatorial GuineaEstoniaEthiopiaEuro areaEurope & Central AsiaEurope & Central Asia (excluding high income)Europe & Central Asia (IDA & IBRD countries)European UnionFaroe IslandsFijiFinlandFragile and conflict affected situationsFranceFrench PolynesiaGabonGambia, TheGeorgiaGermanyGhanaGibraltarGreeceGreenlandGrenadaGuamGuatemalaGuineaGuinea-BissauGuyanaHaitiHeavily indebted poor countries (HIPC)High incomeHondurasHong Kong SAR, ChinaHungaryIBRD onlyIcelandIDA & IBRD totalIDA blendIDA onlyIDA totalIndiaIndonesiaIran, Islamic Rep.IraqIrelandIsraelItalyJamaicaJapanJordanKazakhstanKenyaKiribatiKorea, Dem. People’s Rep.Korea, Rep.KosovoKuwaitKyrgyz RepublicLao PDRLate-demographic dividendLatin America & Caribbean Latin America & Caribbean (excluding high income)Latin America & the Caribbean (IDA & IBRD countries)LatviaLeast developed countries: UN classificationLebanonLiberiaLibyaLithuaniaLow & middle incomeLow incomeLower middle incomeLuxembourgMacao SAR, ChinaMacedonia, FYRMadagascarMalawiMalaysiaMaldivesMaliMaltaMauritaniaMauritiusMexicoMiddle East & North AfricaMiddle East & North Africa (excluding high income)Middle East & North Africa (IDA & IBRD countries)Middle incomeMoldovaMongoliaMontenegroMoroccoMozambiqueMyanmarNauruNepalNetherlandsNew CaledoniaNew ZealandNicaraguaNigerNigeriaNorth AmericaNorwayOECD membersOmanOther small statesPacific island small statesPakistanPanamaPapua New GuineaParaguayPeruPhilippinesPolandPortugalPost-demographic dividendPre-demographic dividendQatarRomaniaRussian FederationRwandaSamoaSao Tome and PrincipeSaudi ArabiaSenegalSerbiaSeychellesSierra LeoneSingaporeSlovak RepublicSloveniaSmall statesSolomon IslandsSomaliaSouth AfricaSouth AsiaSouth Asia (IDA & IBRD)SpainSri LankaSt. Kitts and NevisSt. LuciaSt. Vincent and the GrenadinesSub-Saharan Africa Sub-Saharan Africa (excluding high income)Sub-Saharan Africa (IDA & IBRD countries)SudanSurinameSwedenSwitzerlandSyrian Arab RepublicTajikistanTanzaniaThailandTogoTongaTrinidad and TobagoTunisiaTurkeyTurkmenistanTuvaluUgandaUkraineUnited Arab EmiratesUnited KingdomUnited StatesUpper middle incomeUruguayUzbekistanVanuatuVenezuela, RBVietnamWorldYemen, Rep.ZambiaZimbabwe Timeline:
This timeline shows a graph from 1961 to 2015 of Myanmar. No data until 1960. Number of actual observations by date: 55.
Source name:
World Development Indicators
Source organization:
World Bank staff estimates based data from International Monetary Fund's Direction of Trade database.
Categories, topics:
Private Sector, Trade
Last updated:
apr 23, 2017
Indicators value changes by year
Minimum:
10.252
jan 1, 2015
Maximum:
68.391
jan 1, 1974
At the date of observation
Value
Absolute change
Change from previous value
jan 1, 1961
28.121
+28.121
0.0%
jan 1, 1962
29.149
+1.028
3.66%
jan 1, 1963
33.24
+4.092
14.04%
jan 1, 1964
34.201
+0.961
2.89%
jan 1, 1965
30.398
-3.803
-11.12%
jan 1, 1966
30.726
+0.328
1.08%
jan 1, 1967
35.39
+4.664
15.18%
jan 1, 1968
36.1
+0.711
2.01%
jan 1, 1969
48.996
+12.896
35.72%
jan 1, 1970
52.138
+3.142
6.41%
jan 1, 1971
47.255
-4.883
-9.37%
jan 1, 1972
44.594
-2.661
-5.63%
jan 1, 1973
52.723
+8.129
18.23%
jan 1, 1974
68.391
+15.668
29.72%
jan 1, 1975
44.788
-23.603
-34.51%
jan 1, 1976
52.779
+7.991
17.84%
jan 1, 1977
39.784
-12.995
-24.62%
jan 1, 1978
42.007
+2.223
5.59%
jan 1, 1979
65.509
+23.502
55.95%
jan 1, 1980
57.468
-8.041
-12.27%
jan 1, 1981
48.185
-9.283
-16.15%
jan 1, 1982
45.775
-2.41
-5.0%
jan 1, 1983
45.775
0.0
0.0%
jan 1, 1984
45.775
+0.0
0.0%
jan 1, 1985
45.775
0.0
0.0%
jan 1, 1986
45.775
+0.0
0.0%
jan 1, 1987
45.775
0.0
0.0%
jan 1, 1988
45.775
0.0
0.0%
jan 1, 1989
45.775
0.0
0.0%
jan 1, 1990
45.775
+0.0
0.0%
jan 1, 1991
38.183
-7.592
-16.59%
jan 1, 1992
47.588
+9.405
24.63%
jan 1, 1993
44.828
-2.76
-5.8%
jan 1, 1994
44.077
-0.751
-1.68%
jan 1, 1995
46.694
+2.617
5.94%
jan 1, 1996
46.817
+0.123
0.26%
jan 1, 1997
52.087
+5.27
11.26%
jan 1, 1998
55.65
+3.563
6.84%
jan 1, 1999
55.426
-0.224
-0.4%
jan 1, 2000
53.56
-1.866
-3.37%
jan 1, 2001
56.783
+3.224
6.02%
jan 1, 2002
44.181
-12.602
-22.19%
jan 1, 2003
39.018
-5.163
-11.69%
jan 1, 2004
36.145
-2.872
-7.36%
jan 1, 2005
28.027
-8.118
-22.46%
jan 1, 2006
21.805
-6.222
-22.2%
jan 1, 2007
19.569
-2.237
-10.26%
jan 1, 2008
19.304
-0.264
-1.35%
jan 1, 2009
14.67
-4.635
-24.01%
jan 1, 2010
14.494
-0.176
-1.2%
jan 1, 2011
14.868
+0.375
2.58%
jan 1, 2012
15.945
+1.076
7.24%
jan 1, 2013
17.486
+1.541
9.66%
jan 1, 2014
17.858
+0.372
2.13%
jan 1, 2015
10.252
-7.605
-42.59%
Ranking of countries by current statistics by years


Comments: