29
/
en
AIzaSyAYiBZKx7MnpbEhh9jyipgxe19OcubqV5w
April 1, 2024
30057
Euro area
EMU
false
2
1
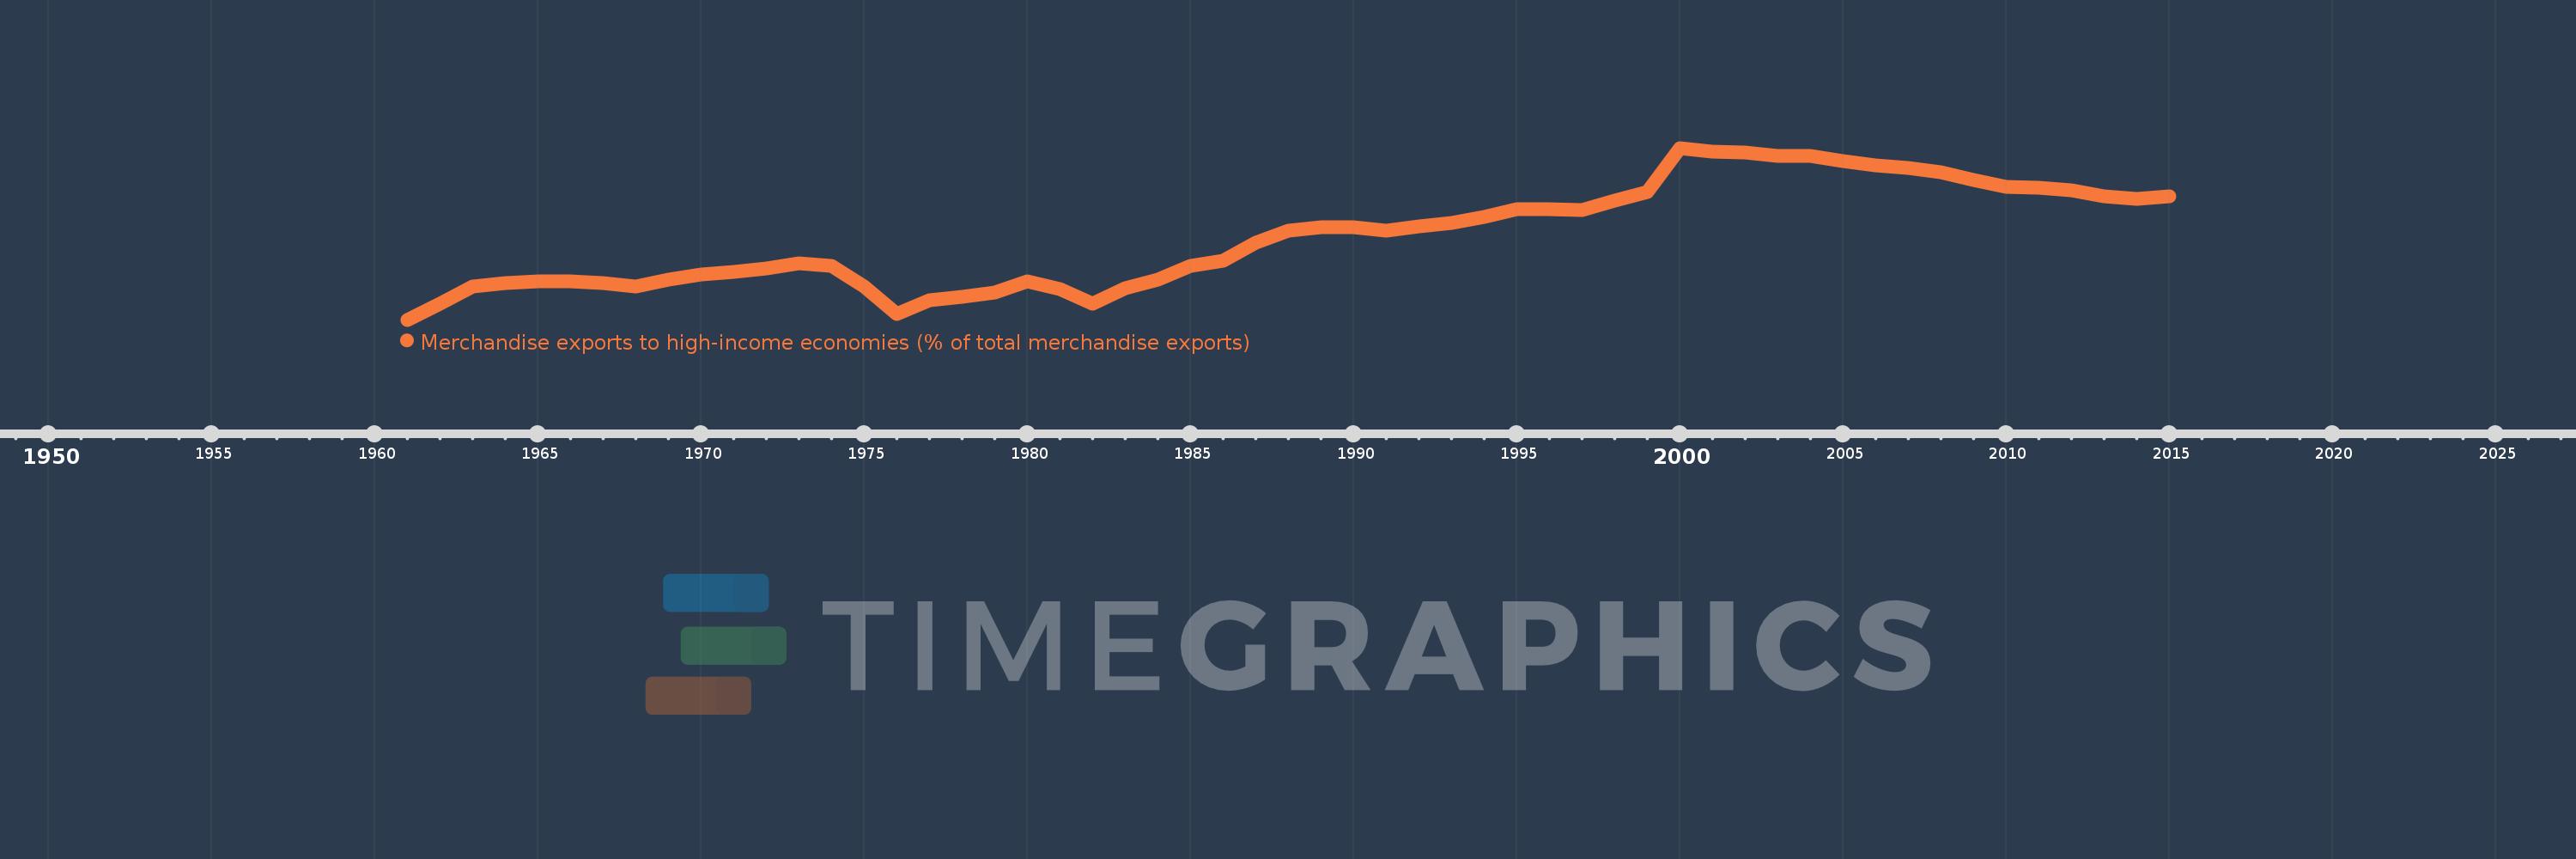
Merchandise exports to high-income economies (% of total merchandise exports)
2015,2014,2013,2012,2011,2010,2009,2008,2007,2006,2005,2004,2003,2002,2001,2000,1999,1998,1997,1996,1995,1994,1993,1992,1991,1990,1989,1988,1987,1986,1985,1984,1983,1982,1981,1980,1979,1978,1977,1976,1975,1974,1973,1972,1971,1970,1969,1968,1967,1966,1965,1964,1963,1962,1961
This statistics in other country:
AfghanistanAlbaniaAlgeriaAmerican SamoaAngolaAntigua and BarbudaArab WorldArgentinaArmeniaArubaAustraliaAustriaAzerbaijanBahamas, TheBahrainBangladeshBarbadosBelarusBelgiumBelizeBeninBermudaBoliviaBosnia and HerzegovinaBrazilBrunei DarussalamBulgariaBurkina FasoBurundiCabo VerdeCambodiaCameroonCanadaCaribbean small statesCentral African RepublicCentral Europe and the BalticsChadChileChinaColombiaComorosCongo, Dem. Rep.Congo, Rep.Costa RicaCote d'IvoireCroatiaCubaCyprusCzech RepublicDenmarkDjiboutiDominicaDominican RepublicEarly-demographic dividendEast Asia & PacificEast Asia & Pacific (excluding high income)East Asia & Pacific (IDA & IBRD countries)EcuadorEgypt, Arab Rep.El SalvadorEquatorial GuineaEstoniaEthiopiaEuro areaEurope & Central AsiaEurope & Central Asia (excluding high income)Europe & Central Asia (IDA & IBRD countries)European UnionFaroe IslandsFijiFinlandFragile and conflict affected situationsFranceFrench PolynesiaGabonGambia, TheGeorgiaGermanyGhanaGibraltarGreeceGreenlandGrenadaGuamGuatemalaGuineaGuinea-BissauGuyanaHaitiHeavily indebted poor countries (HIPC)High incomeHondurasHong Kong SAR, ChinaHungaryIBRD onlyIcelandIDA & IBRD totalIDA blendIDA onlyIDA totalIndiaIndonesiaIran, Islamic Rep.IraqIrelandIsraelItalyJamaicaJapanJordanKazakhstanKenyaKiribatiKorea, Dem. People’s Rep.Korea, Rep.KosovoKuwaitKyrgyz RepublicLao PDRLate-demographic dividendLatin America & Caribbean Latin America & Caribbean (excluding high income)Latin America & the Caribbean (IDA & IBRD countries)LatviaLeast developed countries: UN classificationLebanonLiberiaLibyaLithuaniaLow & middle incomeLow incomeLower middle incomeLuxembourgMacao SAR, ChinaMacedonia, FYRMadagascarMalawiMalaysiaMaldivesMaliMaltaMauritaniaMauritiusMexicoMiddle East & North AfricaMiddle East & North Africa (excluding high income)Middle East & North Africa (IDA & IBRD countries)Middle incomeMoldovaMongoliaMontenegroMoroccoMozambiqueMyanmarNauruNepalNetherlandsNew CaledoniaNew ZealandNicaraguaNigerNigeriaNorth AmericaNorwayOECD membersOmanOther small statesPacific island small statesPakistanPanamaPapua New GuineaParaguayPeruPhilippinesPolandPortugalPost-demographic dividendPre-demographic dividendQatarRomaniaRussian FederationRwandaSamoaSao Tome and PrincipeSaudi ArabiaSenegalSerbiaSeychellesSierra LeoneSingaporeSlovak RepublicSloveniaSmall statesSolomon IslandsSomaliaSouth AfricaSouth AsiaSouth Asia (IDA & IBRD)SpainSri LankaSt. Kitts and NevisSt. LuciaSt. Vincent and the GrenadinesSub-Saharan Africa Sub-Saharan Africa (excluding high income)Sub-Saharan Africa (IDA & IBRD countries)SudanSurinameSwedenSwitzerlandSyrian Arab RepublicTajikistanTanzaniaThailandTogoTongaTrinidad and TobagoTunisiaTurkeyTurkmenistanTuvaluUgandaUkraineUnited Arab EmiratesUnited KingdomUnited StatesUpper middle incomeUruguayUzbekistanVanuatuVenezuela, RBVietnamWorldYemen, Rep.ZambiaZimbabwe Timeline:
This timeline shows a graph from 1961 to 2015 of Euro area. No data until 1960. Number of actual observations by date: 55.
Source name:
World Development Indicators
Source organization:
World Bank staff estimates based data from International Monetary Fund's Direction of Trade database.
Categories, topics:
Private Sector, Trade
Last updated:
apr 23, 2017
Indicators value changes by year
Minimum:
67.698
jan 1, 1961
Maximum:
89.563
jan 1, 2000
At the date of observation
Value
Absolute change
Change from previous value
jan 1, 1961
67.698
+67.698
0.0%
jan 1, 1962
69.78
+2.081
3.07%
jan 1, 1963
71.924
+2.144
3.07%
jan 1, 1964
72.357
+0.434
0.6%
jan 1, 1965
72.615
+0.257
0.36%
jan 1, 1966
72.636
+0.021
0.03%
jan 1, 1967
72.323
-0.313
-0.43%
jan 1, 1968
71.938
-0.385
-0.53%
jan 1, 1969
72.774
+0.836
1.16%
jan 1, 1970
73.416
+0.641
0.88%
jan 1, 1971
73.832
+0.416
0.57%
jan 1, 1972
74.217
+0.385
0.52%
jan 1, 1973
74.905
+0.688
0.93%
jan 1, 1974
74.519
-0.386
-0.52%
jan 1, 1975
71.9
-2.619
-3.51%
jan 1, 1976
68.392
-3.507
-4.88%
jan 1, 1977
70.196
+1.804
2.64%
jan 1, 1978
70.613
+0.417
0.59%
jan 1, 1979
71.195
+0.581
0.82%
jan 1, 1980
72.618
+1.424
2.0%
jan 1, 1981
71.552
-1.066
-1.47%
jan 1, 1982
69.762
-1.791
-2.5%
jan 1, 1983
71.683
+1.922
2.75%
jan 1, 1984
72.793
+1.11
1.55%
jan 1, 1985
74.553
+1.76
2.42%
jan 1, 1986
75.26
+0.707
0.95%
jan 1, 1987
77.499
+2.239
2.97%
jan 1, 1988
79.018
+1.52
1.96%
jan 1, 1989
79.466
+0.448
0.57%
jan 1, 1990
79.509
+0.042
0.05%
jan 1, 1991
79.051
-0.457
-0.58%
jan 1, 1992
79.588
+0.536
0.68%
jan 1, 1993
80.025
+0.438
0.55%
jan 1, 1994
80.82
+0.794
0.99%
jan 1, 1995
81.729
+0.909
1.13%
jan 1, 1996
81.788
+0.058
0.07%
jan 1, 1997
81.705
-0.083
-0.1%
jan 1, 1998
82.902
+1.198
1.47%
jan 1, 1999
83.963
+1.06
1.28%
jan 1, 2000
89.563
+5.6
6.67%
jan 1, 2001
89.141
-0.422
-0.47%
jan 1, 2002
88.976
-0.165
-0.19%
jan 1, 2003
88.528
-0.448
-0.5%
jan 1, 2004
88.547
+0.018
0.02%
jan 1, 2005
87.918
-0.628
-0.71%
jan 1, 2006
87.389
-0.529
-0.6%
jan 1, 2007
86.974
-0.416
-0.48%
jan 1, 2008
86.492
-0.482
-0.55%
jan 1, 2009
85.52
-0.971
-1.12%
jan 1, 2010
84.571
-0.949
-1.11%
jan 1, 2011
84.482
-0.089
-0.11%
jan 1, 2012
84.188
-0.294
-0.35%
jan 1, 2013
83.409
-0.779
-0.93%
jan 1, 2014
83.069
-0.339
-0.41%
jan 1, 2015
83.438
+0.369
0.44%
Ranking of countries by current statistics by years


Comments: