29
/
en
AIzaSyAYiBZKx7MnpbEhh9jyipgxe19OcubqV5w
April 1, 2024
234875
Saudi Arabia
SAU
true
2
1
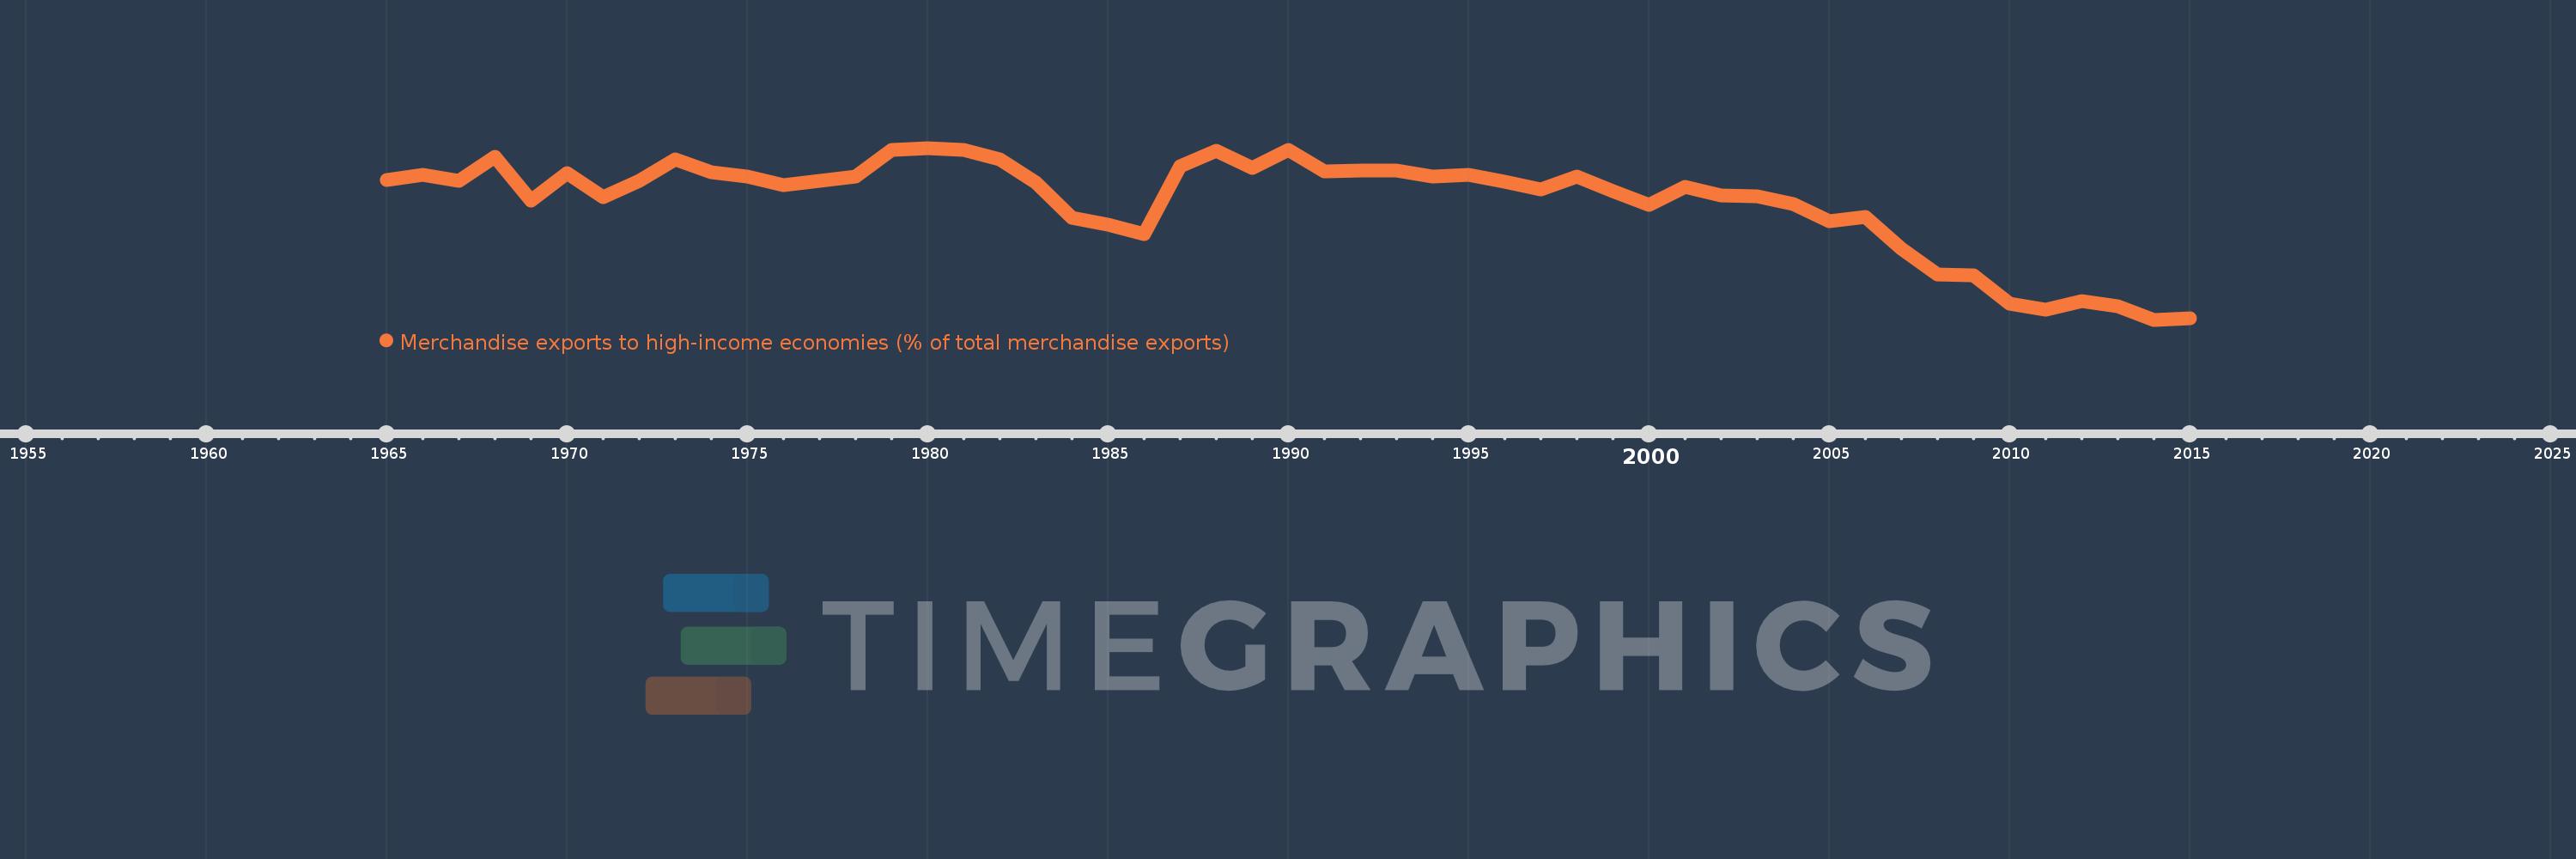
Merchandise exports to high-income economies (% of total merchandise exports)
2015,2014,2013,2012,2011,2010,2009,2008,2007,2006,2005,2004,2003,2002,2001,2000,1999,1998,1997,1996,1995,1994,1993,1992,1991,1990,1989,1988,1987,1986,1985,1984,1983,1982,1981,1980,1979,1978,1977,1976,1975,1974,1973,1972,1971,1970,1969,1968,1967,1966,1965
This statistics in other country:
AfghanistanAlbaniaAlgeriaAmerican SamoaAngolaAntigua and BarbudaArab WorldArgentinaArmeniaArubaAustraliaAustriaAzerbaijanBahamas, TheBahrainBangladeshBarbadosBelarusBelgiumBelizeBeninBermudaBoliviaBosnia and HerzegovinaBrazilBrunei DarussalamBulgariaBurkina FasoBurundiCabo VerdeCambodiaCameroonCanadaCaribbean small statesCentral African RepublicCentral Europe and the BalticsChadChileChinaColombiaComorosCongo, Dem. Rep.Congo, Rep.Costa RicaCote d'IvoireCroatiaCubaCyprusCzech RepublicDenmarkDjiboutiDominicaDominican RepublicEarly-demographic dividendEast Asia & PacificEast Asia & Pacific (excluding high income)East Asia & Pacific (IDA & IBRD countries)EcuadorEgypt, Arab Rep.El SalvadorEquatorial GuineaEstoniaEthiopiaEuro areaEurope & Central AsiaEurope & Central Asia (excluding high income)Europe & Central Asia (IDA & IBRD countries)European UnionFaroe IslandsFijiFinlandFragile and conflict affected situationsFranceFrench PolynesiaGabonGambia, TheGeorgiaGermanyGhanaGibraltarGreeceGreenlandGrenadaGuamGuatemalaGuineaGuinea-BissauGuyanaHaitiHeavily indebted poor countries (HIPC)High incomeHondurasHong Kong SAR, ChinaHungaryIBRD onlyIcelandIDA & IBRD totalIDA blendIDA onlyIDA totalIndiaIndonesiaIran, Islamic Rep.IraqIrelandIsraelItalyJamaicaJapanJordanKazakhstanKenyaKiribatiKorea, Dem. People’s Rep.Korea, Rep.KosovoKuwaitKyrgyz RepublicLao PDRLate-demographic dividendLatin America & Caribbean Latin America & Caribbean (excluding high income)Latin America & the Caribbean (IDA & IBRD countries)LatviaLeast developed countries: UN classificationLebanonLiberiaLibyaLithuaniaLow & middle incomeLow incomeLower middle incomeLuxembourgMacao SAR, ChinaMacedonia, FYRMadagascarMalawiMalaysiaMaldivesMaliMaltaMauritaniaMauritiusMexicoMiddle East & North AfricaMiddle East & North Africa (excluding high income)Middle East & North Africa (IDA & IBRD countries)Middle incomeMoldovaMongoliaMontenegroMoroccoMozambiqueMyanmarNauruNepalNetherlandsNew CaledoniaNew ZealandNicaraguaNigerNigeriaNorth AmericaNorwayOECD membersOmanOther small statesPacific island small statesPakistanPanamaPapua New GuineaParaguayPeruPhilippinesPolandPortugalPost-demographic dividendPre-demographic dividendQatarRomaniaRussian FederationRwandaSamoaSao Tome and PrincipeSaudi ArabiaSenegalSerbiaSeychellesSierra LeoneSingaporeSlovak RepublicSloveniaSmall statesSolomon IslandsSomaliaSouth AfricaSouth AsiaSouth Asia (IDA & IBRD)SpainSri LankaSt. Kitts and NevisSt. LuciaSt. Vincent and the GrenadinesSub-Saharan Africa Sub-Saharan Africa (excluding high income)Sub-Saharan Africa (IDA & IBRD countries)SudanSurinameSwedenSwitzerlandSyrian Arab RepublicTajikistanTanzaniaThailandTogoTongaTrinidad and TobagoTunisiaTurkeyTurkmenistanTuvaluUgandaUkraineUnited Arab EmiratesUnited KingdomUnited StatesUpper middle incomeUruguayUzbekistanVanuatuVenezuela, RBVietnamWorldYemen, Rep.ZambiaZimbabwe Timeline:
This timeline shows a graph from 1965 to 2015 of Saudi Arabia. No data until 1964. Number of actual observations by date: 51.
Source name:
World Development Indicators
Source organization:
World Bank staff estimates based data from International Monetary Fund's Direction of Trade database.
Categories, topics:
Private Sector, Trade
Last updated:
apr 23, 2017
Indicators value changes by year
Minimum:
59.461
jan 1, 2014
Maximum:
85.846
jan 1, 1980
At the date of observation
Value
Absolute change
Change from previous value
jan 1, 1965
80.982
+80.982
0.0%
jan 1, 1966
81.675
+0.692
0.86%
jan 1, 1967
80.766
-0.909
-1.11%
jan 1, 1968
84.539
+3.773
4.67%
jan 1, 1969
77.794
-6.745
-7.98%
jan 1, 1970
81.982
+4.188
5.38%
jan 1, 1971
78.274
-3.708
-4.52%
jan 1, 1972
80.784
+2.51
3.21%
jan 1, 1973
84.066
+3.283
4.06%
jan 1, 1974
82.173
-1.893
-2.25%
jan 1, 1975
81.428
-0.745
-0.91%
jan 1, 1976
80.155
-1.273
-1.56%
jan 1, 1977
80.809
+0.654
0.82%
jan 1, 1978
81.465
+0.656
0.81%
jan 1, 1979
85.583
+4.118
5.06%
jan 1, 1980
85.846
+0.263
0.31%
jan 1, 1981
85.504
-0.342
-0.4%
jan 1, 1982
84.04
-1.464
-1.71%
jan 1, 1983
80.537
-3.503
-4.17%
jan 1, 1984
75.123
-5.414
-6.72%
jan 1, 1985
74.065
-1.058
-1.41%
jan 1, 1986
72.598
-1.466
-1.98%
jan 1, 1987
82.992
+10.393
14.32%
jan 1, 1988
85.347
+2.355
2.84%
jan 1, 1989
82.805
-2.542
-2.98%
jan 1, 1990
85.515
+2.71
3.27%
jan 1, 1991
82.262
-3.253
-3.8%
jan 1, 1992
82.319
+0.057
0.07%
jan 1, 1993
82.42
+0.101
0.12%
jan 1, 1994
81.454
-0.966
-1.17%
jan 1, 1995
81.721
+0.267
0.33%
jan 1, 1996
80.66
-1.061
-1.3%
jan 1, 1997
79.436
-1.224
-1.52%
jan 1, 1998
81.439
+2.003
2.52%
jan 1, 1999
79.23
-2.209
-2.71%
jan 1, 2000
77.049
-2.181
-2.75%
jan 1, 2001
79.81
+2.761
3.58%
jan 1, 2002
78.563
-1.247
-1.56%
jan 1, 2003
78.376
-0.187
-0.24%
jan 1, 2004
77.217
-1.16
-1.48%
jan 1, 2005
74.559
-2.657
-3.44%
jan 1, 2006
75.191
+0.632
0.85%
jan 1, 2007
70.313
-4.878
-6.49%
jan 1, 2008
66.453
-3.86
-5.49%
jan 1, 2009
66.258
-0.195
-0.29%
jan 1, 2010
61.944
-4.314
-6.51%
jan 1, 2011
60.953
-0.991
-1.6%
jan 1, 2012
62.282
+1.329
2.18%
jan 1, 2013
61.531
-0.75
-1.2%
jan 1, 2014
59.461
-2.071
-3.37%
jan 1, 2015
59.664
+0.203
0.34%
Ranking of countries by current statistics by years


Comments: