29
/
en
AIzaSyAYiBZKx7MnpbEhh9jyipgxe19OcubqV5w
April 1, 2024
125076
Egypt, Arab Rep.
EGY
true
2
1
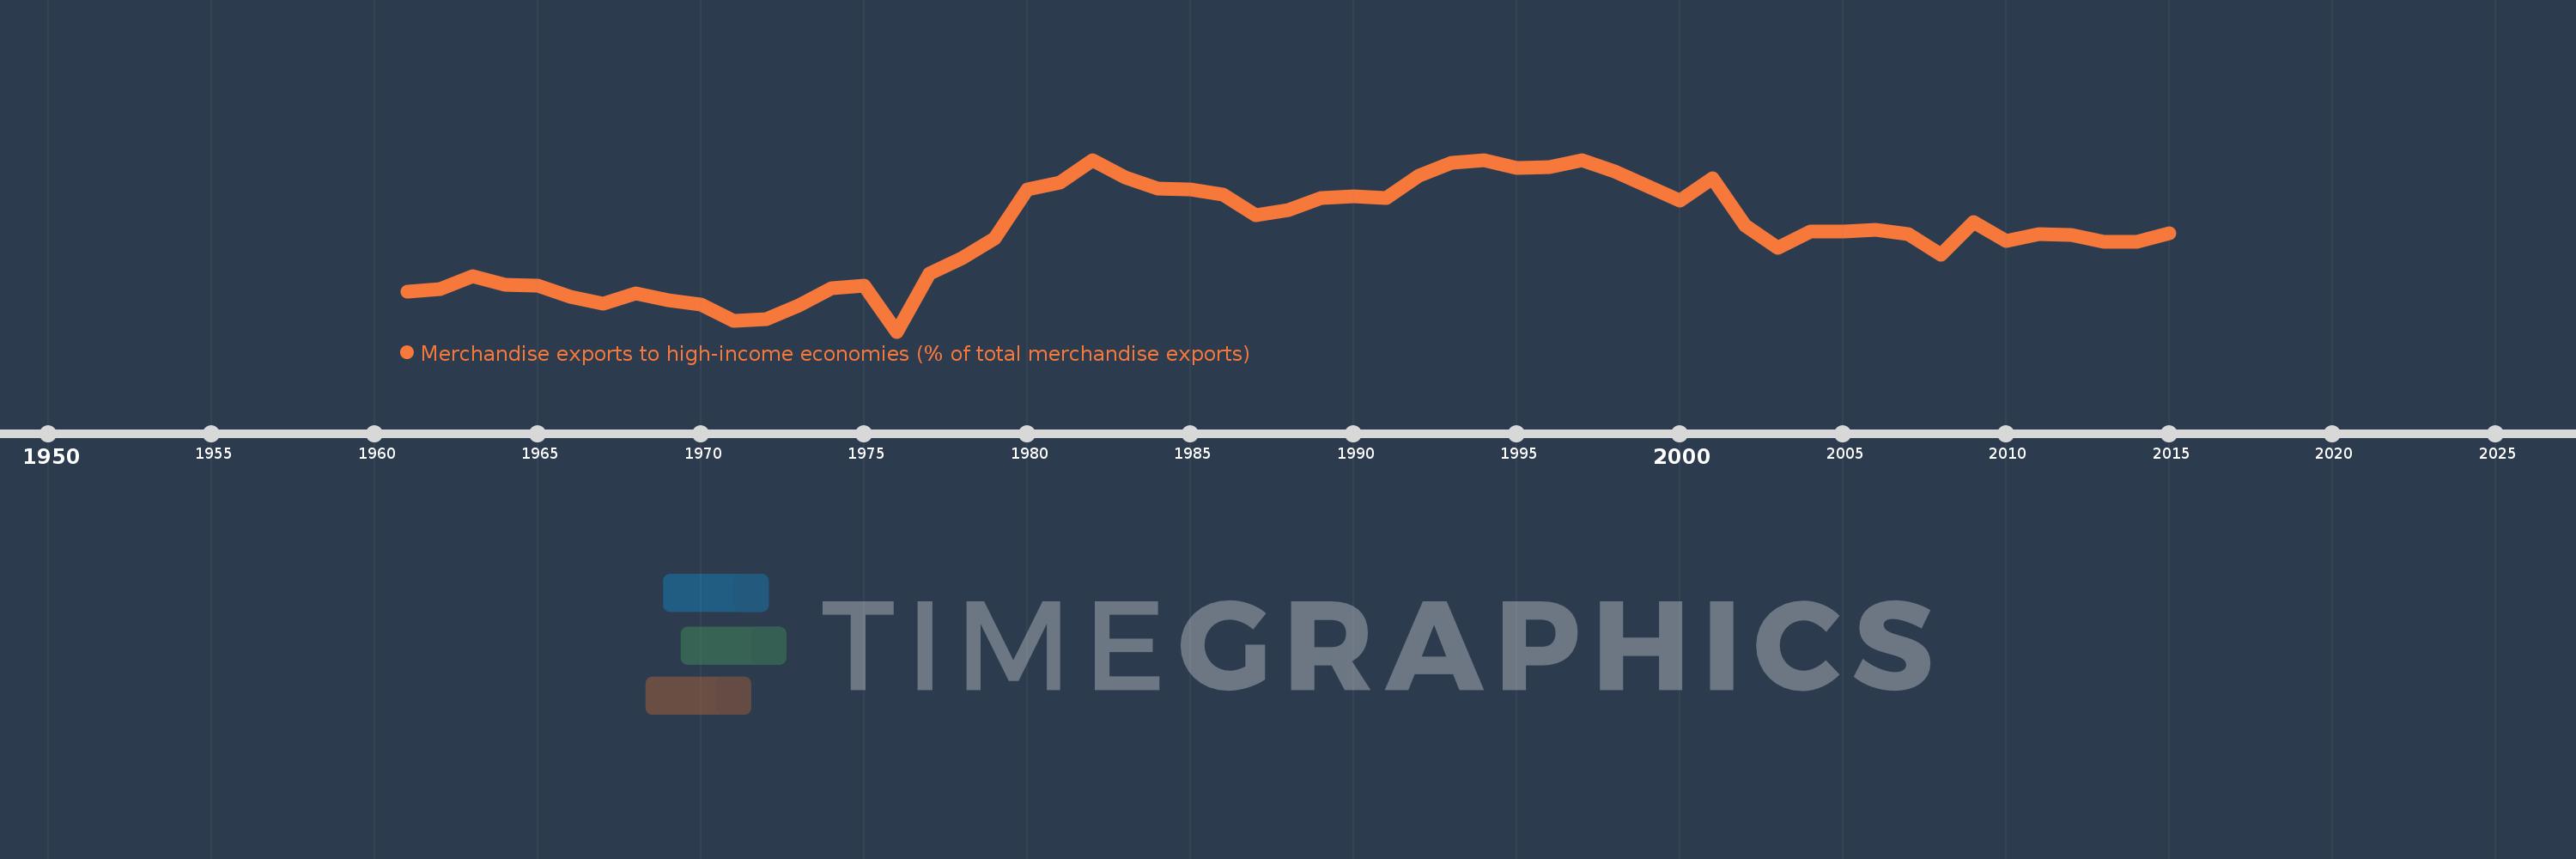
Merchandise exports to high-income economies (% of total merchandise exports)
2015,2014,2013,2012,2011,2010,2009,2008,2007,2006,2005,2004,2003,2002,2001,2000,1999,1998,1997,1996,1995,1994,1993,1992,1991,1990,1989,1988,1987,1986,1985,1984,1983,1982,1981,1980,1979,1978,1977,1976,1975,1974,1973,1972,1971,1970,1969,1968,1967,1966,1965,1964,1963,1962,1961
This statistics in other country:
AfghanistanAlbaniaAlgeriaAmerican SamoaAngolaAntigua and BarbudaArab WorldArgentinaArmeniaArubaAustraliaAustriaAzerbaijanBahamas, TheBahrainBangladeshBarbadosBelarusBelgiumBelizeBeninBermudaBoliviaBosnia and HerzegovinaBrazilBrunei DarussalamBulgariaBurkina FasoBurundiCabo VerdeCambodiaCameroonCanadaCaribbean small statesCentral African RepublicCentral Europe and the BalticsChadChileChinaColombiaComorosCongo, Dem. Rep.Congo, Rep.Costa RicaCote d'IvoireCroatiaCubaCyprusCzech RepublicDenmarkDjiboutiDominicaDominican RepublicEarly-demographic dividendEast Asia & PacificEast Asia & Pacific (excluding high income)East Asia & Pacific (IDA & IBRD countries)EcuadorEgypt, Arab Rep.El SalvadorEquatorial GuineaEstoniaEthiopiaEuro areaEurope & Central AsiaEurope & Central Asia (excluding high income)Europe & Central Asia (IDA & IBRD countries)European UnionFaroe IslandsFijiFinlandFragile and conflict affected situationsFranceFrench PolynesiaGabonGambia, TheGeorgiaGermanyGhanaGibraltarGreeceGreenlandGrenadaGuamGuatemalaGuineaGuinea-BissauGuyanaHaitiHeavily indebted poor countries (HIPC)High incomeHondurasHong Kong SAR, ChinaHungaryIBRD onlyIcelandIDA & IBRD totalIDA blendIDA onlyIDA totalIndiaIndonesiaIran, Islamic Rep.IraqIrelandIsraelItalyJamaicaJapanJordanKazakhstanKenyaKiribatiKorea, Dem. People’s Rep.Korea, Rep.KosovoKuwaitKyrgyz RepublicLao PDRLate-demographic dividendLatin America & Caribbean Latin America & Caribbean (excluding high income)Latin America & the Caribbean (IDA & IBRD countries)LatviaLeast developed countries: UN classificationLebanonLiberiaLibyaLithuaniaLow & middle incomeLow incomeLower middle incomeLuxembourgMacao SAR, ChinaMacedonia, FYRMadagascarMalawiMalaysiaMaldivesMaliMaltaMauritaniaMauritiusMexicoMiddle East & North AfricaMiddle East & North Africa (excluding high income)Middle East & North Africa (IDA & IBRD countries)Middle incomeMoldovaMongoliaMontenegroMoroccoMozambiqueMyanmarNauruNepalNetherlandsNew CaledoniaNew ZealandNicaraguaNigerNigeriaNorth AmericaNorwayOECD membersOmanOther small statesPacific island small statesPakistanPanamaPapua New GuineaParaguayPeruPhilippinesPolandPortugalPost-demographic dividendPre-demographic dividendQatarRomaniaRussian FederationRwandaSamoaSao Tome and PrincipeSaudi ArabiaSenegalSerbiaSeychellesSierra LeoneSingaporeSlovak RepublicSloveniaSmall statesSolomon IslandsSomaliaSouth AfricaSouth AsiaSouth Asia (IDA & IBRD)SpainSri LankaSt. Kitts and NevisSt. LuciaSt. Vincent and the GrenadinesSub-Saharan Africa Sub-Saharan Africa (excluding high income)Sub-Saharan Africa (IDA & IBRD countries)SudanSurinameSwedenSwitzerlandSyrian Arab RepublicTajikistanTanzaniaThailandTogoTongaTrinidad and TobagoTunisiaTurkeyTurkmenistanTuvaluUgandaUkraineUnited Arab EmiratesUnited KingdomUnited StatesUpper middle incomeUruguayUzbekistanVanuatuVenezuela, RBVietnamWorldYemen, Rep.ZambiaZimbabwe Timeline:
This timeline shows a graph from 1961 to 2015 of Egypt, Arab Rep.. No data until 1960. Number of actual observations by date: 55.
Source name:
World Development Indicators
Source organization:
World Bank staff estimates based data from International Monetary Fund's Direction of Trade database.
Categories, topics:
Private Sector, Trade
Last updated:
apr 23, 2017
Indicators value changes by year
Minimum:
20.585
jan 1, 1976
Maximum:
80.219
jan 1, 1982
At the date of observation
Value
Absolute change
Change from previous value
jan 1, 1961
34.351
+34.351
0.0%
jan 1, 1962
35.288
+0.937
2.73%
jan 1, 1963
39.879
+4.591
13.01%
jan 1, 1964
36.906
-2.974
-7.46%
jan 1, 1965
36.617
-0.289
-0.78%
jan 1, 1966
32.551
-4.066
-11.1%
jan 1, 1967
30.401
-2.15
-6.61%
jan 1, 1968
33.763
+3.362
11.06%
jan 1, 1969
31.359
-2.404
-7.12%
jan 1, 1970
30.005
-1.354
-4.32%
jan 1, 1971
24.326
-5.68
-18.93%
jan 1, 1972
24.85
+0.525
2.16%
jan 1, 1973
29.58
+4.73
19.03%
jan 1, 1974
35.562
+5.982
20.22%
jan 1, 1975
36.533
+0.971
2.73%
jan 1, 1976
20.585
-15.947
-43.65%
jan 1, 1977
40.767
+20.181
98.04%
jan 1, 1978
46.195
+5.429
13.32%
jan 1, 1979
53.029
+6.834
14.79%
jan 1, 1980
70.061
+17.032
32.12%
jan 1, 1981
72.344
+2.283
3.26%
jan 1, 1982
80.219
+7.875
10.89%
jan 1, 1983
74.165
-6.054
-7.55%
jan 1, 1984
70.166
-4.0
-5.39%
jan 1, 1985
69.811
-0.355
-0.51%
jan 1, 1986
68.052
-1.759
-2.52%
jan 1, 1987
61.047
-7.005
-10.29%
jan 1, 1988
62.655
+1.608
2.63%
jan 1, 1989
66.949
+4.294
6.85%
jan 1, 1990
67.623
+0.675
1.01%
jan 1, 1991
66.829
-0.794
-1.17%
jan 1, 1992
74.737
+7.908
11.83%
jan 1, 1993
79.29
+4.552
6.09%
jan 1, 1994
79.956
+0.667
0.84%
jan 1, 1995
77.517
-2.439
-3.05%
jan 1, 1996
77.542
+0.025
0.03%
jan 1, 1997
80.167
+2.625
3.39%
jan 1, 1998
76.245
-3.922
-4.89%
jan 1, 1999
71.046
-5.199
-6.82%
jan 1, 2000
66.1
-4.947
-6.96%
jan 1, 2001
73.797
+7.698
11.65%
jan 1, 2002
57.497
-16.3
-22.09%
jan 1, 2003
49.714
-7.783
-13.54%
jan 1, 2004
55.365
+5.651
11.37%
jan 1, 2005
55.404
+0.039
0.07%
jan 1, 2006
56.065
+0.661
1.19%
jan 1, 2007
54.397
-1.668
-2.97%
jan 1, 2008
47.407
-6.99
-12.85%
jan 1, 2009
58.568
+11.161
23.54%
jan 1, 2010
52.101
-6.468
-11.04%
jan 1, 2011
54.442
+2.341
4.49%
jan 1, 2012
54.252
-0.19
-0.35%
jan 1, 2013
51.82
-2.432
-4.48%
jan 1, 2014
51.852
+0.032
0.06%
jan 1, 2015
54.648
+2.795
5.39%
Ranking of countries by current statistics by years


Comments: