29
/
en
AIzaSyAYiBZKx7MnpbEhh9jyipgxe19OcubqV5w
April 1, 2024
38339
IDA blend
IDB
false
2
1
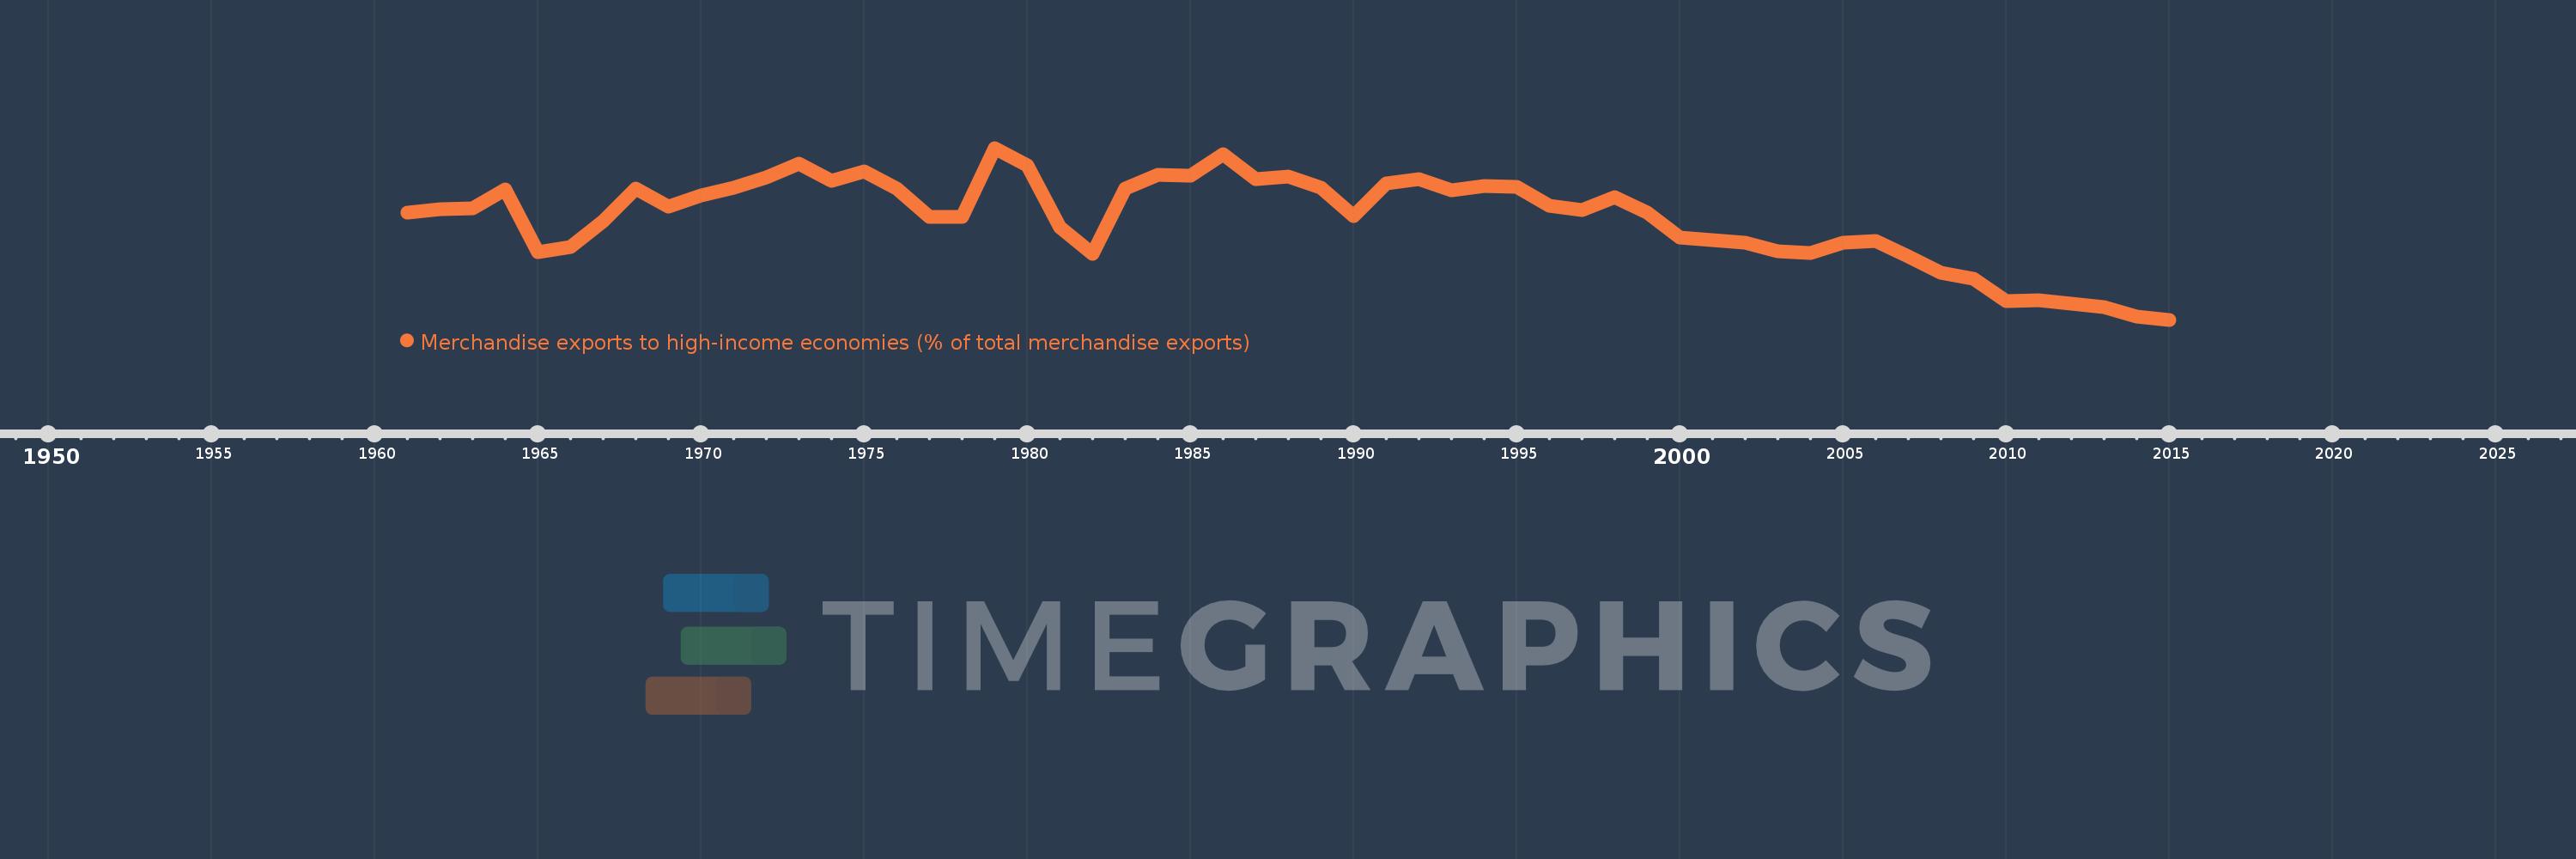
Merchandise exports to high-income economies (% of total merchandise exports)
2015,2014,2013,2012,2011,2010,2009,2008,2007,2006,2005,2004,2003,2002,2001,2000,1999,1998,1997,1996,1995,1994,1993,1992,1991,1990,1989,1988,1987,1986,1985,1984,1983,1982,1981,1980,1979,1978,1977,1976,1975,1974,1973,1972,1971,1970,1969,1968,1967,1966,1965,1964,1963,1962,1961
This statistics in other country:
AfghanistanAlbaniaAlgeriaAmerican SamoaAngolaAntigua and BarbudaArab WorldArgentinaArmeniaArubaAustraliaAustriaAzerbaijanBahamas, TheBahrainBangladeshBarbadosBelarusBelgiumBelizeBeninBermudaBoliviaBosnia and HerzegovinaBrazilBrunei DarussalamBulgariaBurkina FasoBurundiCabo VerdeCambodiaCameroonCanadaCaribbean small statesCentral African RepublicCentral Europe and the BalticsChadChileChinaColombiaComorosCongo, Dem. Rep.Congo, Rep.Costa RicaCote d'IvoireCroatiaCubaCyprusCzech RepublicDenmarkDjiboutiDominicaDominican RepublicEarly-demographic dividendEast Asia & PacificEast Asia & Pacific (excluding high income)East Asia & Pacific (IDA & IBRD countries)EcuadorEgypt, Arab Rep.El SalvadorEquatorial GuineaEstoniaEthiopiaEuro areaEurope & Central AsiaEurope & Central Asia (excluding high income)Europe & Central Asia (IDA & IBRD countries)European UnionFaroe IslandsFijiFinlandFragile and conflict affected situationsFranceFrench PolynesiaGabonGambia, TheGeorgiaGermanyGhanaGibraltarGreeceGreenlandGrenadaGuamGuatemalaGuineaGuinea-BissauGuyanaHaitiHeavily indebted poor countries (HIPC)High incomeHondurasHong Kong SAR, ChinaHungaryIBRD onlyIcelandIDA & IBRD totalIDA blendIDA onlyIDA totalIndiaIndonesiaIran, Islamic Rep.IraqIrelandIsraelItalyJamaicaJapanJordanKazakhstanKenyaKiribatiKorea, Dem. People’s Rep.Korea, Rep.KosovoKuwaitKyrgyz RepublicLao PDRLate-demographic dividendLatin America & Caribbean Latin America & Caribbean (excluding high income)Latin America & the Caribbean (IDA & IBRD countries)LatviaLeast developed countries: UN classificationLebanonLiberiaLibyaLithuaniaLow & middle incomeLow incomeLower middle incomeLuxembourgMacao SAR, ChinaMacedonia, FYRMadagascarMalawiMalaysiaMaldivesMaliMaltaMauritaniaMauritiusMexicoMiddle East & North AfricaMiddle East & North Africa (excluding high income)Middle East & North Africa (IDA & IBRD countries)Middle incomeMoldovaMongoliaMontenegroMoroccoMozambiqueMyanmarNauruNepalNetherlandsNew CaledoniaNew ZealandNicaraguaNigerNigeriaNorth AmericaNorwayOECD membersOmanOther small statesPacific island small statesPakistanPanamaPapua New GuineaParaguayPeruPhilippinesPolandPortugalPost-demographic dividendPre-demographic dividendQatarRomaniaRussian FederationRwandaSamoaSao Tome and PrincipeSaudi ArabiaSenegalSerbiaSeychellesSierra LeoneSingaporeSlovak RepublicSloveniaSmall statesSolomon IslandsSomaliaSouth AfricaSouth AsiaSouth Asia (IDA & IBRD)SpainSri LankaSt. Kitts and NevisSt. LuciaSt. Vincent and the GrenadinesSub-Saharan Africa Sub-Saharan Africa (excluding high income)Sub-Saharan Africa (IDA & IBRD countries)SudanSurinameSwedenSwitzerlandSyrian Arab RepublicTajikistanTanzaniaThailandTogoTongaTrinidad and TobagoTunisiaTurkeyTurkmenistanTuvaluUgandaUkraineUnited Arab EmiratesUnited KingdomUnited StatesUpper middle incomeUruguayUzbekistanVanuatuVenezuela, RBVietnamWorldYemen, Rep.ZambiaZimbabwe Timeline:
This timeline shows a graph from 1961 to 2015 of IDA blend. No data until 1960. Number of actual observations by date: 55.
Source name:
World Development Indicators
Source organization:
World Bank staff estimates based data from International Monetary Fund's Direction of Trade database.
Categories, topics:
Private Sector, Trade
Last updated:
apr 23, 2017
Indicators value changes by year
Minimum:
60.793
jan 1, 2015
Maximum:
84.214
jan 1, 1979
At the date of observation
Value
Absolute change
Change from previous value
jan 1, 1961
75.442
+75.442
0.0%
jan 1, 1962
75.881
+0.44
0.58%
jan 1, 1963
75.984
+0.103
0.14%
jan 1, 1964
78.507
+2.522
3.32%
jan 1, 1965
70.004
-8.503
-10.83%
jan 1, 1966
70.732
+0.728
1.04%
jan 1, 1967
74.202
+3.47
4.91%
jan 1, 1968
78.714
+4.511
6.08%
jan 1, 1969
76.166
-2.548
-3.24%
jan 1, 1970
77.771
+1.606
2.11%
jan 1, 1971
78.806
+1.035
1.33%
jan 1, 1972
80.246
+1.44
1.83%
jan 1, 1973
82.054
+1.808
2.25%
jan 1, 1974
79.77
-2.284
-2.78%
jan 1, 1975
80.984
+1.215
1.52%
jan 1, 1976
78.728
-2.257
-2.79%
jan 1, 1977
74.785
-3.943
-5.01%
jan 1, 1978
74.794
+0.009
0.01%
jan 1, 1979
84.214
+9.419
12.59%
jan 1, 1980
81.867
-2.347
-2.79%
jan 1, 1981
73.415
-8.452
-10.32%
jan 1, 1982
69.729
-3.686
-5.02%
jan 1, 1983
78.646
+8.917
12.79%
jan 1, 1984
80.542
+1.895
2.41%
jan 1, 1985
80.438
-0.104
-0.13%
jan 1, 1986
83.385
+2.947
3.66%
jan 1, 1987
79.923
-3.462
-4.15%
jan 1, 1988
80.296
+0.373
0.47%
jan 1, 1989
78.755
-1.541
-1.92%
jan 1, 1990
74.917
-3.838
-4.87%
jan 1, 1991
79.365
+4.447
5.94%
jan 1, 1992
79.94
+0.576
0.73%
jan 1, 1993
78.463
-1.478
-1.85%
jan 1, 1994
79.001
+0.539
0.69%
jan 1, 1995
78.852
-0.149
-0.19%
jan 1, 1996
76.314
-2.539
-3.22%
jan 1, 1997
75.712
-0.601
-0.79%
jan 1, 1998
77.514
+1.801
2.38%
jan 1, 1999
75.343
-2.171
-2.8%
jan 1, 2000
71.959
-3.383
-4.49%
jan 1, 2001
71.61
-0.349
-0.49%
jan 1, 2002
71.253
-0.357
-0.5%
jan 1, 2003
70.07
-1.183
-1.66%
jan 1, 2004
69.903
-0.168
-0.24%
jan 1, 2005
71.311
+1.408
2.01%
jan 1, 2006
71.539
+0.229
0.32%
jan 1, 2007
69.473
-2.067
-2.89%
jan 1, 2008
67.176
-2.297
-3.31%
jan 1, 2009
66.396
-0.78
-1.16%
jan 1, 2010
63.388
-3.008
-4.53%
jan 1, 2011
63.424
+0.037
0.06%
jan 1, 2012
62.941
-0.483
-0.76%
jan 1, 2013
62.486
-0.455
-0.72%
jan 1, 2014
61.253
-1.232
-1.97%
jan 1, 2015
60.793
-0.461
-0.75%
Ranking of countries by current statistics by years


Comments: