29
/
en
AIzaSyAYiBZKx7MnpbEhh9jyipgxe19OcubqV5w
April 1, 2024
265996
Tonga
TON
true
2
1
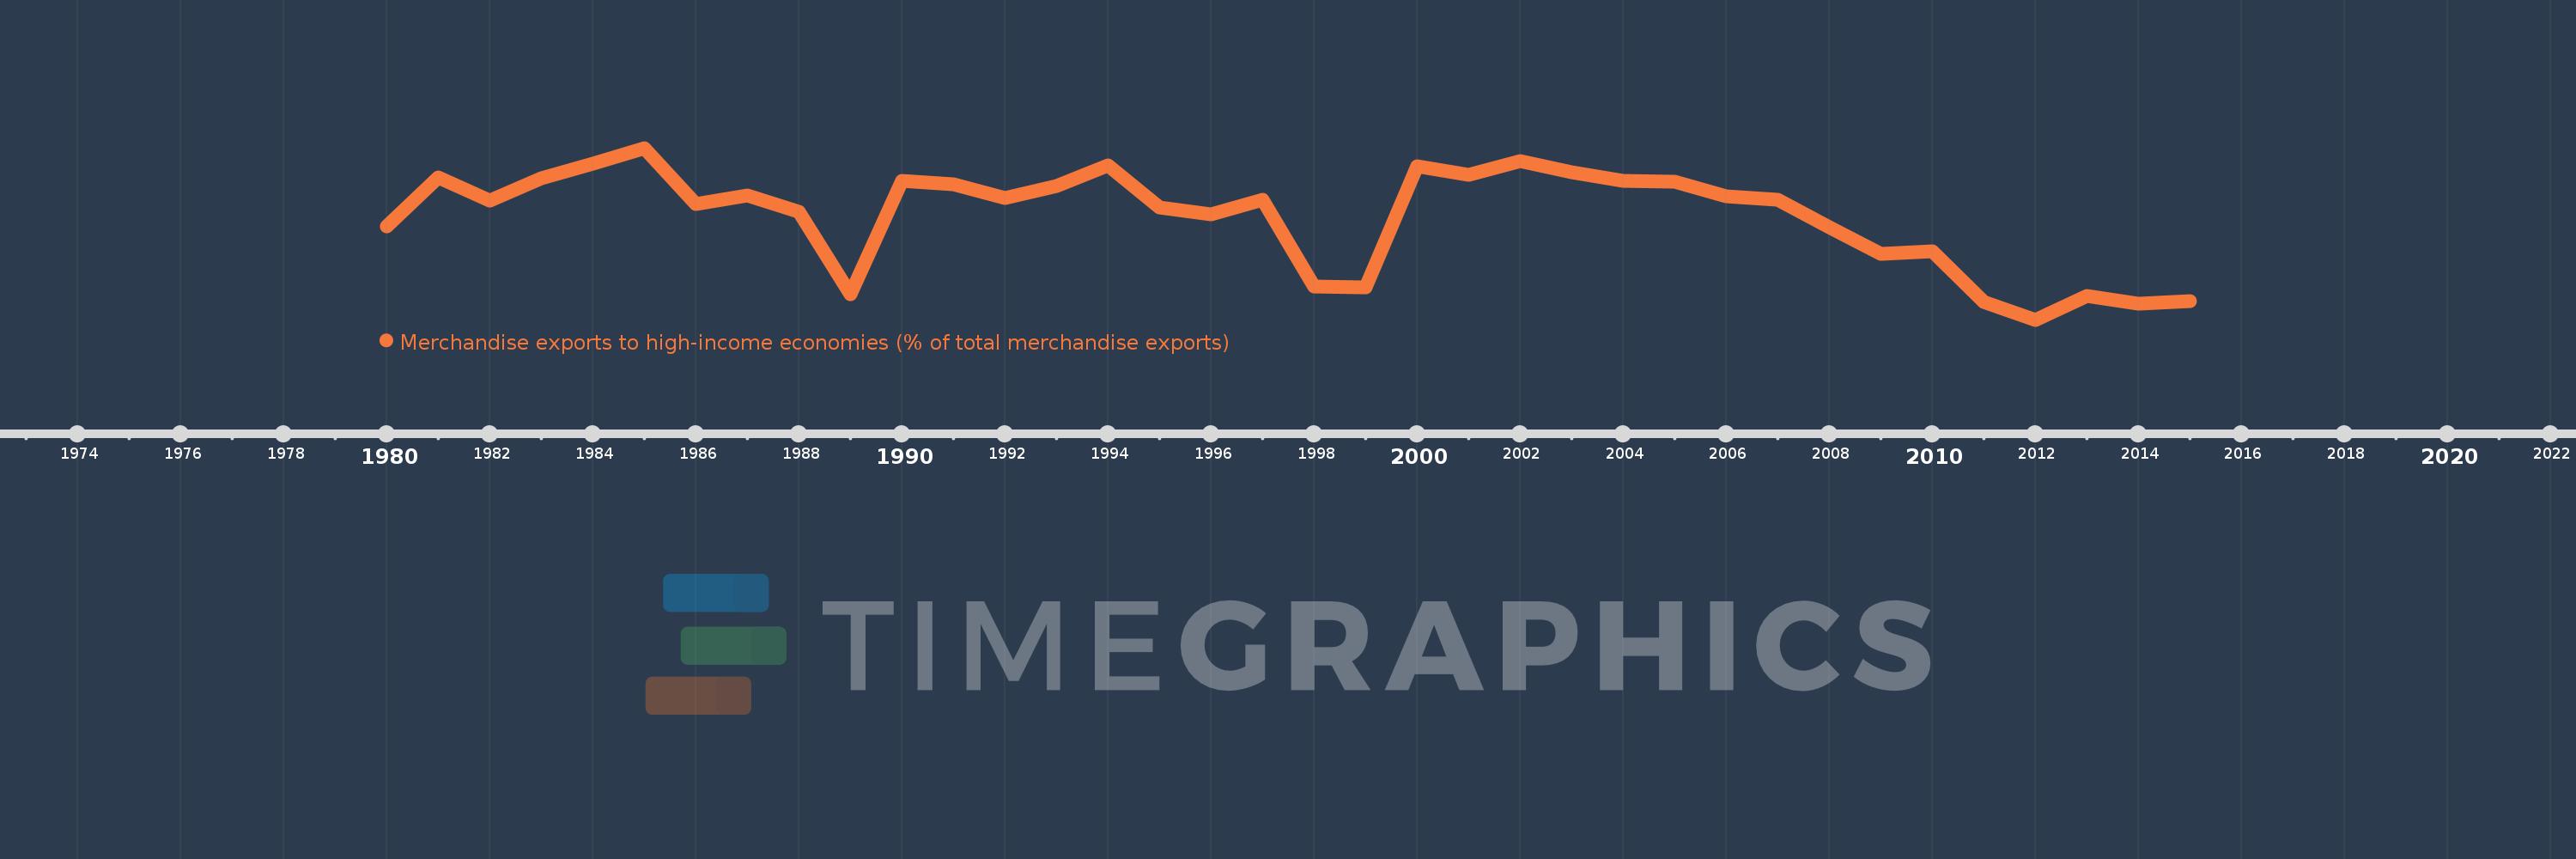
Merchandise exports to high-income economies (% of total merchandise exports)
2015,2014,2013,2012,2011,2010,2009,2008,2007,2006,2005,2004,2003,2002,2001,2000,1999,1998,1997,1996,1995,1994,1993,1992,1991,1990,1989,1988,1987,1986,1985,1984,1983,1982,1981,1980
This statistics in other country:
AfghanistanAlbaniaAlgeriaAmerican SamoaAngolaAntigua and BarbudaArab WorldArgentinaArmeniaArubaAustraliaAustriaAzerbaijanBahamas, TheBahrainBangladeshBarbadosBelarusBelgiumBelizeBeninBermudaBoliviaBosnia and HerzegovinaBrazilBrunei DarussalamBulgariaBurkina FasoBurundiCabo VerdeCambodiaCameroonCanadaCaribbean small statesCentral African RepublicCentral Europe and the BalticsChadChileChinaColombiaComorosCongo, Dem. Rep.Congo, Rep.Costa RicaCote d'IvoireCroatiaCubaCyprusCzech RepublicDenmarkDjiboutiDominicaDominican RepublicEarly-demographic dividendEast Asia & PacificEast Asia & Pacific (excluding high income)East Asia & Pacific (IDA & IBRD countries)EcuadorEgypt, Arab Rep.El SalvadorEquatorial GuineaEstoniaEthiopiaEuro areaEurope & Central AsiaEurope & Central Asia (excluding high income)Europe & Central Asia (IDA & IBRD countries)European UnionFaroe IslandsFijiFinlandFragile and conflict affected situationsFranceFrench PolynesiaGabonGambia, TheGeorgiaGermanyGhanaGibraltarGreeceGreenlandGrenadaGuamGuatemalaGuineaGuinea-BissauGuyanaHaitiHeavily indebted poor countries (HIPC)High incomeHondurasHong Kong SAR, ChinaHungaryIBRD onlyIcelandIDA & IBRD totalIDA blendIDA onlyIDA totalIndiaIndonesiaIran, Islamic Rep.IraqIrelandIsraelItalyJamaicaJapanJordanKazakhstanKenyaKiribatiKorea, Dem. People’s Rep.Korea, Rep.KosovoKuwaitKyrgyz RepublicLao PDRLate-demographic dividendLatin America & Caribbean Latin America & Caribbean (excluding high income)Latin America & the Caribbean (IDA & IBRD countries)LatviaLeast developed countries: UN classificationLebanonLiberiaLibyaLithuaniaLow & middle incomeLow incomeLower middle incomeLuxembourgMacao SAR, ChinaMacedonia, FYRMadagascarMalawiMalaysiaMaldivesMaliMaltaMauritaniaMauritiusMexicoMiddle East & North AfricaMiddle East & North Africa (excluding high income)Middle East & North Africa (IDA & IBRD countries)Middle incomeMoldovaMongoliaMontenegroMoroccoMozambiqueMyanmarNauruNepalNetherlandsNew CaledoniaNew ZealandNicaraguaNigerNigeriaNorth AmericaNorwayOECD membersOmanOther small statesPacific island small statesPakistanPanamaPapua New GuineaParaguayPeruPhilippinesPolandPortugalPost-demographic dividendPre-demographic dividendQatarRomaniaRussian FederationRwandaSamoaSao Tome and PrincipeSaudi ArabiaSenegalSerbiaSeychellesSierra LeoneSingaporeSlovak RepublicSloveniaSmall statesSolomon IslandsSomaliaSouth AfricaSouth AsiaSouth Asia (IDA & IBRD)SpainSri LankaSt. Kitts and NevisSt. LuciaSt. Vincent and the GrenadinesSub-Saharan Africa Sub-Saharan Africa (excluding high income)Sub-Saharan Africa (IDA & IBRD countries)SudanSurinameSwedenSwitzerlandSyrian Arab RepublicTajikistanTanzaniaThailandTogoTongaTrinidad and TobagoTunisiaTurkeyTurkmenistanTuvaluUgandaUkraineUnited Arab EmiratesUnited KingdomUnited StatesUpper middle incomeUruguayUzbekistanVanuatuVenezuela, RBVietnamWorldYemen, Rep.ZambiaZimbabwe Timeline:
This timeline shows a graph from 1980 to 2015 of Tonga. No data until 1979. Number of actual observations by date: 36.
Source name:
World Development Indicators
Source organization:
World Bank staff estimates based data from International Monetary Fund's Direction of Trade database.
Categories, topics:
Private Sector, Trade
Last updated:
apr 23, 2017
Indicators value changes by year
Minimum:
68.592
jan 1, 2012
Maximum:
98.781
jan 1, 1985
At the date of observation
Value
Absolute change
Change from previous value
jan 1, 1980
85.009
+85.009
0.0%
jan 1, 1981
93.678
+8.669
10.2%
jan 1, 1982
89.469
-4.209
-4.49%
jan 1, 1983
93.379
+3.911
4.37%
jan 1, 1984
96.087
+2.707
2.9%
jan 1, 1985
98.781
+2.694
2.8%
jan 1, 1986
88.88
-9.901
-10.02%
jan 1, 1987
90.434
+1.554
1.75%
jan 1, 1988
87.572
-2.862
-3.16%
jan 1, 1989
73.099
-14.473
-16.53%
jan 1, 1990
92.935
+19.836
27.14%
jan 1, 1991
92.374
-0.561
-0.6%
jan 1, 1992
89.979
-2.395
-2.59%
jan 1, 1993
92.126
+2.147
2.39%
jan 1, 1994
95.737
+3.611
3.92%
jan 1, 1995
88.295
-7.442
-7.77%
jan 1, 1996
87.109
-1.186
-1.34%
jan 1, 1997
89.644
+2.535
2.91%
jan 1, 1998
74.447
-15.198
-16.95%
jan 1, 1999
74.273
-0.173
-0.23%
jan 1, 2000
95.588
+21.315
28.7%
jan 1, 2001
94.112
-1.477
-1.54%
jan 1, 2002
96.424
+2.312
2.46%
jan 1, 2003
94.513
-1.911
-1.98%
jan 1, 2004
92.987
-1.526
-1.61%
jan 1, 2005
92.886
-0.101
-0.11%
jan 1, 2006
90.358
-2.528
-2.72%
jan 1, 2007
89.667
-0.691
-0.76%
jan 1, 2008
84.922
-4.745
-5.29%
jan 1, 2009
80.186
-4.736
-5.58%
jan 1, 2010
80.565
+0.379
0.47%
jan 1, 2011
71.773
-8.792
-10.91%
jan 1, 2012
68.592
-3.181
-4.43%
jan 1, 2013
72.802
+4.21
6.14%
jan 1, 2014
71.347
-1.455
-2.0%
jan 1, 2015
71.87
+0.522
0.73%
Ranking of countries by current statistics by years


Comments: