29
/
en
AIzaSyAYiBZKx7MnpbEhh9jyipgxe19OcubqV5w
April 1, 2024
93854
Bulgaria
BGR
true
2
1
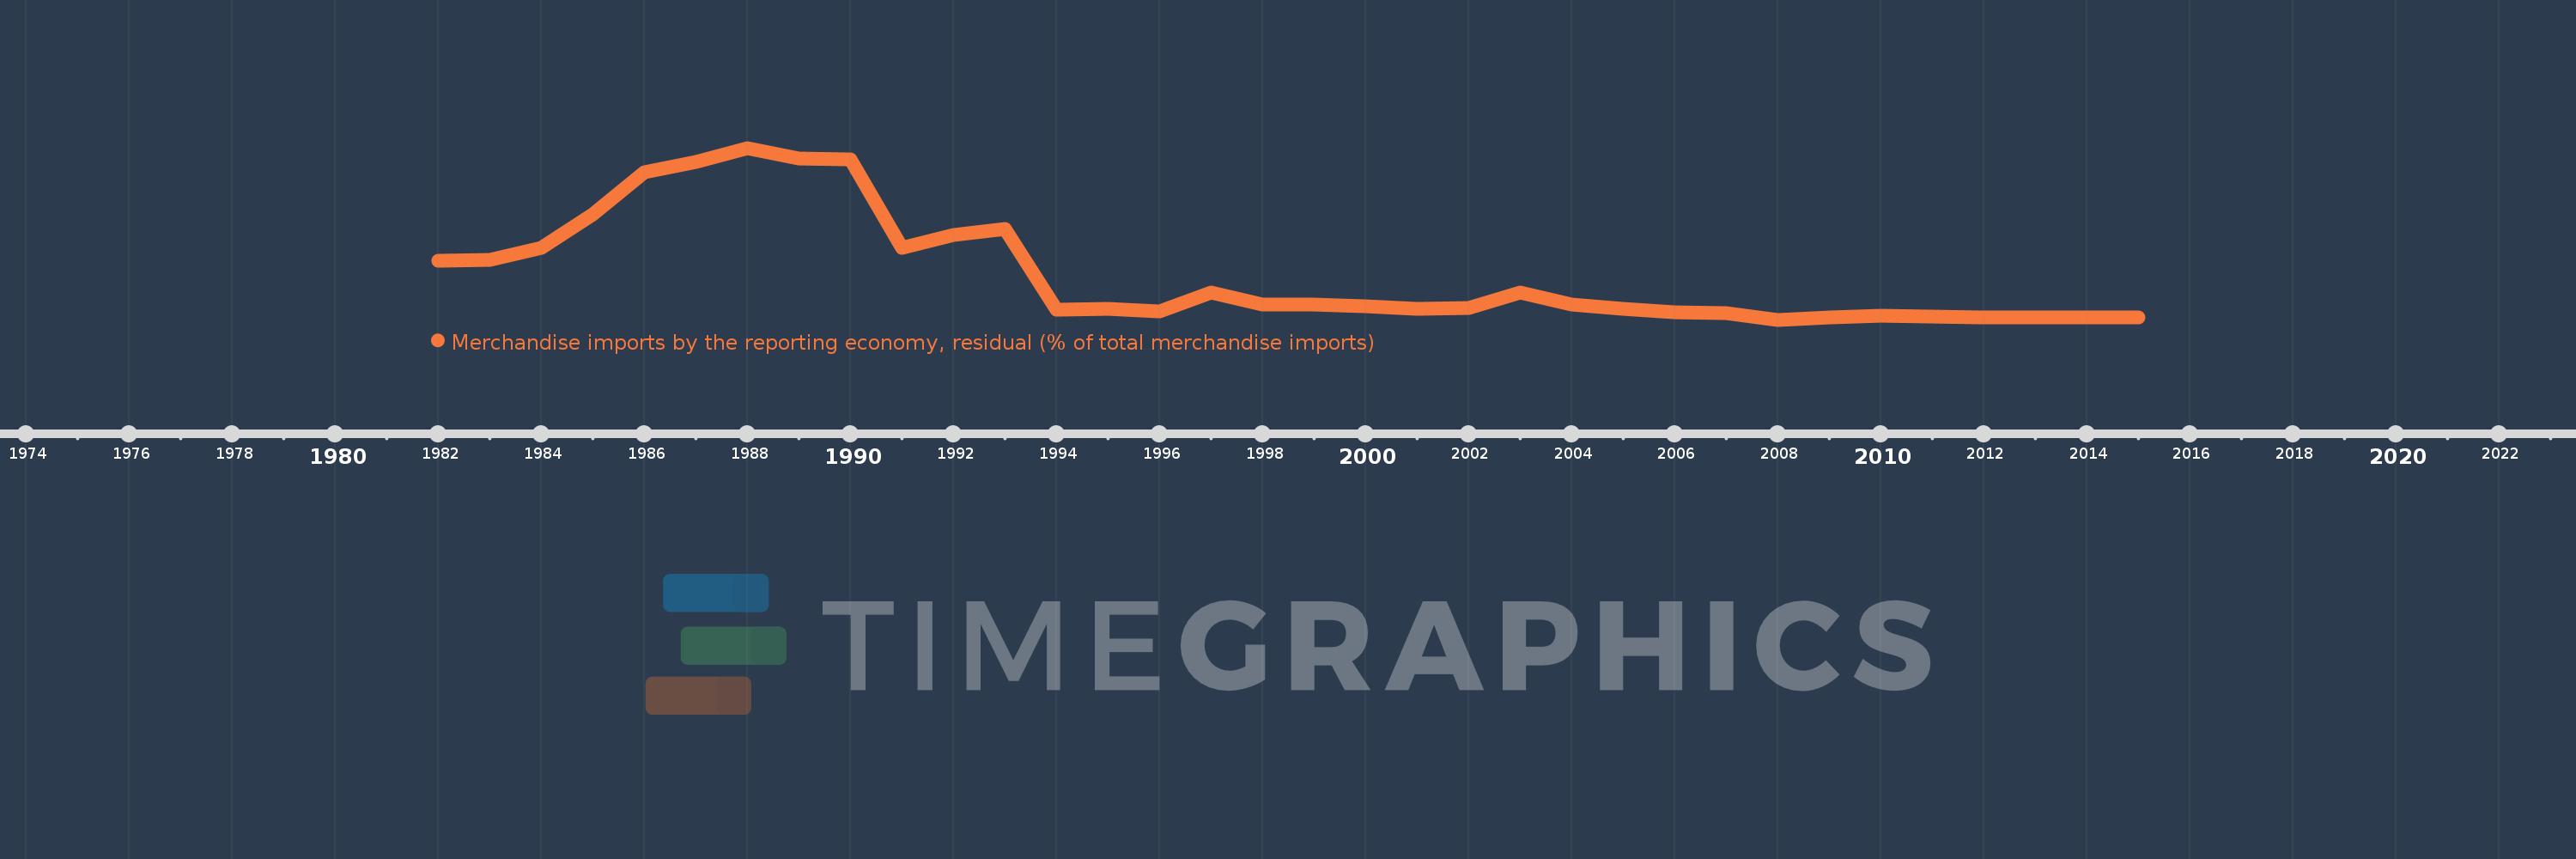
Merchandise imports by the reporting economy, residual (% of total merchandise imports)
2015,2014,2013,2012,2011,2010,2009,2008,2007,2006,2005,2004,2003,2002,2001,2000,1999,1998,1997,1996,1995,1994,1993,1992,1991,1990,1989,1988,1987,1986,1985,1984,1983,1982
This statistics in other country:
AfghanistanAlbaniaAlgeriaAmerican SamoaAngolaAntigua and BarbudaArab WorldArgentinaArmeniaArubaAustraliaAustriaAzerbaijanBahamas, TheBahrainBangladeshBarbadosBelarusBelgiumBelizeBeninBermudaBoliviaBosnia and HerzegovinaBrazilBrunei DarussalamBulgariaBurkina FasoBurundiCabo VerdeCambodiaCameroonCanadaCaribbean small statesCentral African RepublicCentral Europe and the BalticsChadChileChinaColombiaComorosCongo, Dem. Rep.Congo, Rep.Costa RicaCote d'IvoireCroatiaCubaCyprusCzech RepublicDenmarkDjiboutiDominicaDominican RepublicEarly-demographic dividendEast Asia & PacificEast Asia & Pacific (excluding high income)East Asia & Pacific (IDA & IBRD countries)EcuadorEgypt, Arab Rep.El SalvadorEquatorial GuineaEstoniaEthiopiaEuro areaEurope & Central AsiaEurope & Central Asia (excluding high income)Europe & Central Asia (IDA & IBRD countries)European UnionFaroe IslandsFijiFinlandFragile and conflict affected situationsFranceFrench PolynesiaGabonGambia, TheGeorgiaGermanyGhanaGibraltarGreeceGreenlandGrenadaGuamGuatemalaGuineaGuinea-BissauGuyanaHaitiHeavily indebted poor countries (HIPC)High incomeHondurasHong Kong SAR, ChinaHungaryIBRD onlyIcelandIDA & IBRD totalIDA blendIDA onlyIDA totalIndiaIndonesiaIran, Islamic Rep.IraqIrelandIsraelItalyJamaicaJapanJordanKazakhstanKenyaKiribatiKorea, Dem. People’s Rep.Korea, Rep.KosovoKuwaitKyrgyz RepublicLao PDRLate-demographic dividendLatin America & Caribbean Latin America & Caribbean (excluding high income)Latin America & the Caribbean (IDA & IBRD countries)LatviaLeast developed countries: UN classificationLebanonLiberiaLibyaLithuaniaLow & middle incomeLow incomeLower middle incomeLuxembourgMacao SAR, ChinaMacedonia, FYRMadagascarMalawiMalaysiaMaldivesMaliMaltaMauritaniaMauritiusMexicoMiddle East & North AfricaMiddle East & North Africa (excluding high income)Middle East & North Africa (IDA & IBRD countries)Middle incomeMoldovaMongoliaMontenegroMoroccoMozambiqueMyanmarNauruNepalNetherlandsNew CaledoniaNew ZealandNicaraguaNigerNigeriaNorth AmericaNorwayOECD membersOmanOther small statesPacific island small statesPakistanPanamaPapua New GuineaParaguayPeruPhilippinesPolandPortugalPost-demographic dividendPre-demographic dividendQatarRomaniaRussian FederationRwandaSamoaSao Tome and PrincipeSaudi ArabiaSenegalSerbiaSeychellesSierra LeoneSingaporeSlovak RepublicSloveniaSmall statesSolomon IslandsSomaliaSouth AfricaSouth AsiaSouth Asia (IDA & IBRD)SpainSri LankaSt. Kitts and NevisSt. LuciaSt. Vincent and the GrenadinesSub-Saharan Africa Sub-Saharan Africa (excluding high income)Sub-Saharan Africa (IDA & IBRD countries)SudanSurinameSwedenSwitzerlandSyrian Arab RepublicTajikistanTanzaniaThailandTogoTongaTrinidad and TobagoTunisiaTurkeyTurkmenistanTuvaluUgandaUkraineUnited Arab EmiratesUnited KingdomUnited StatesUpper middle incomeUruguayUzbekistanVanuatuVenezuela, RBVietnamWorldYemen, Rep.ZambiaZimbabwe Timeline:
This timeline shows a graph from 1982 to 2015 of Bulgaria. No data until 1981. Number of actual observations by date: 34.
Source name:
World Development Indicators
Source organization:
World Bank staff estimates based data from International Monetary Fund's Direction of Trade database.
Categories, topics:
Private Sector, Trade
Last updated:
apr 23, 2017
Indicators value changes by year
Maximum:
33.595
jan 1, 1988
At the date of observation
Value
Absolute change
Change from previous value
jan 1, 1982
11.483
+11.483
0.0%
jan 1, 1983
11.729
+0.246
2.14%
jan 1, 1984
14.039
+2.31
19.7%
jan 1, 1985
20.692
+6.653
47.39%
jan 1, 1986
28.802
+8.11
39.2%
jan 1, 1987
30.933
+2.13
7.4%
jan 1, 1988
33.595
+2.662
8.61%
jan 1, 1989
31.502
-2.092
-6.23%
jan 1, 1990
31.435
-0.067
-0.21%
jan 1, 1991
14.034
-17.401
-55.36%
jan 1, 1992
16.576
+2.541
18.11%
jan 1, 1993
17.845
+1.27
7.66%
jan 1, 1994
1.921
-15.924
-89.24%
jan 1, 1995
2.127
+0.206
10.75%
jan 1, 1996
1.64
-0.488
-22.93%
jan 1, 1997
5.36
+3.721
226.94%
jan 1, 1998
2.981
-2.379
-44.38%
jan 1, 1999
3.072
+0.091
3.04%
jan 1, 2000
2.715
-0.357
-11.64%
jan 1, 2001
2.208
-0.507
-18.66%
jan 1, 2002
2.352
+0.144
6.53%
jan 1, 2003
5.335
+2.982
126.79%
jan 1, 2004
2.912
-2.422
-45.41%
jan 1, 2005
2.203
-0.709
-24.35%
jan 1, 2006
1.516
-0.687
-31.18%
jan 1, 2007
1.307
-0.209
-13.77%
jan 1, 2008
0.017
-1.291
-98.72%
jan 1, 2009
0.489
+0.472
2.82K%
jan 1, 2010
0.787
+0.298
60.85%
jan 1, 2011
0.601
-0.186
-23.59%
jan 1, 2012
0.455
-0.146
-24.26%
jan 1, 2013
0.447
-0.008
-1.73%
jan 1, 2014
0.43
-0.017
-3.79%
jan 1, 2015
0.493
+0.062
14.48%
Ranking of countries by current statistics by years


Comments: