29
/
en
AIzaSyAYiBZKx7MnpbEhh9jyipgxe19OcubqV5w
April 1, 2024
66287
Algeria
DZA
true
2
1
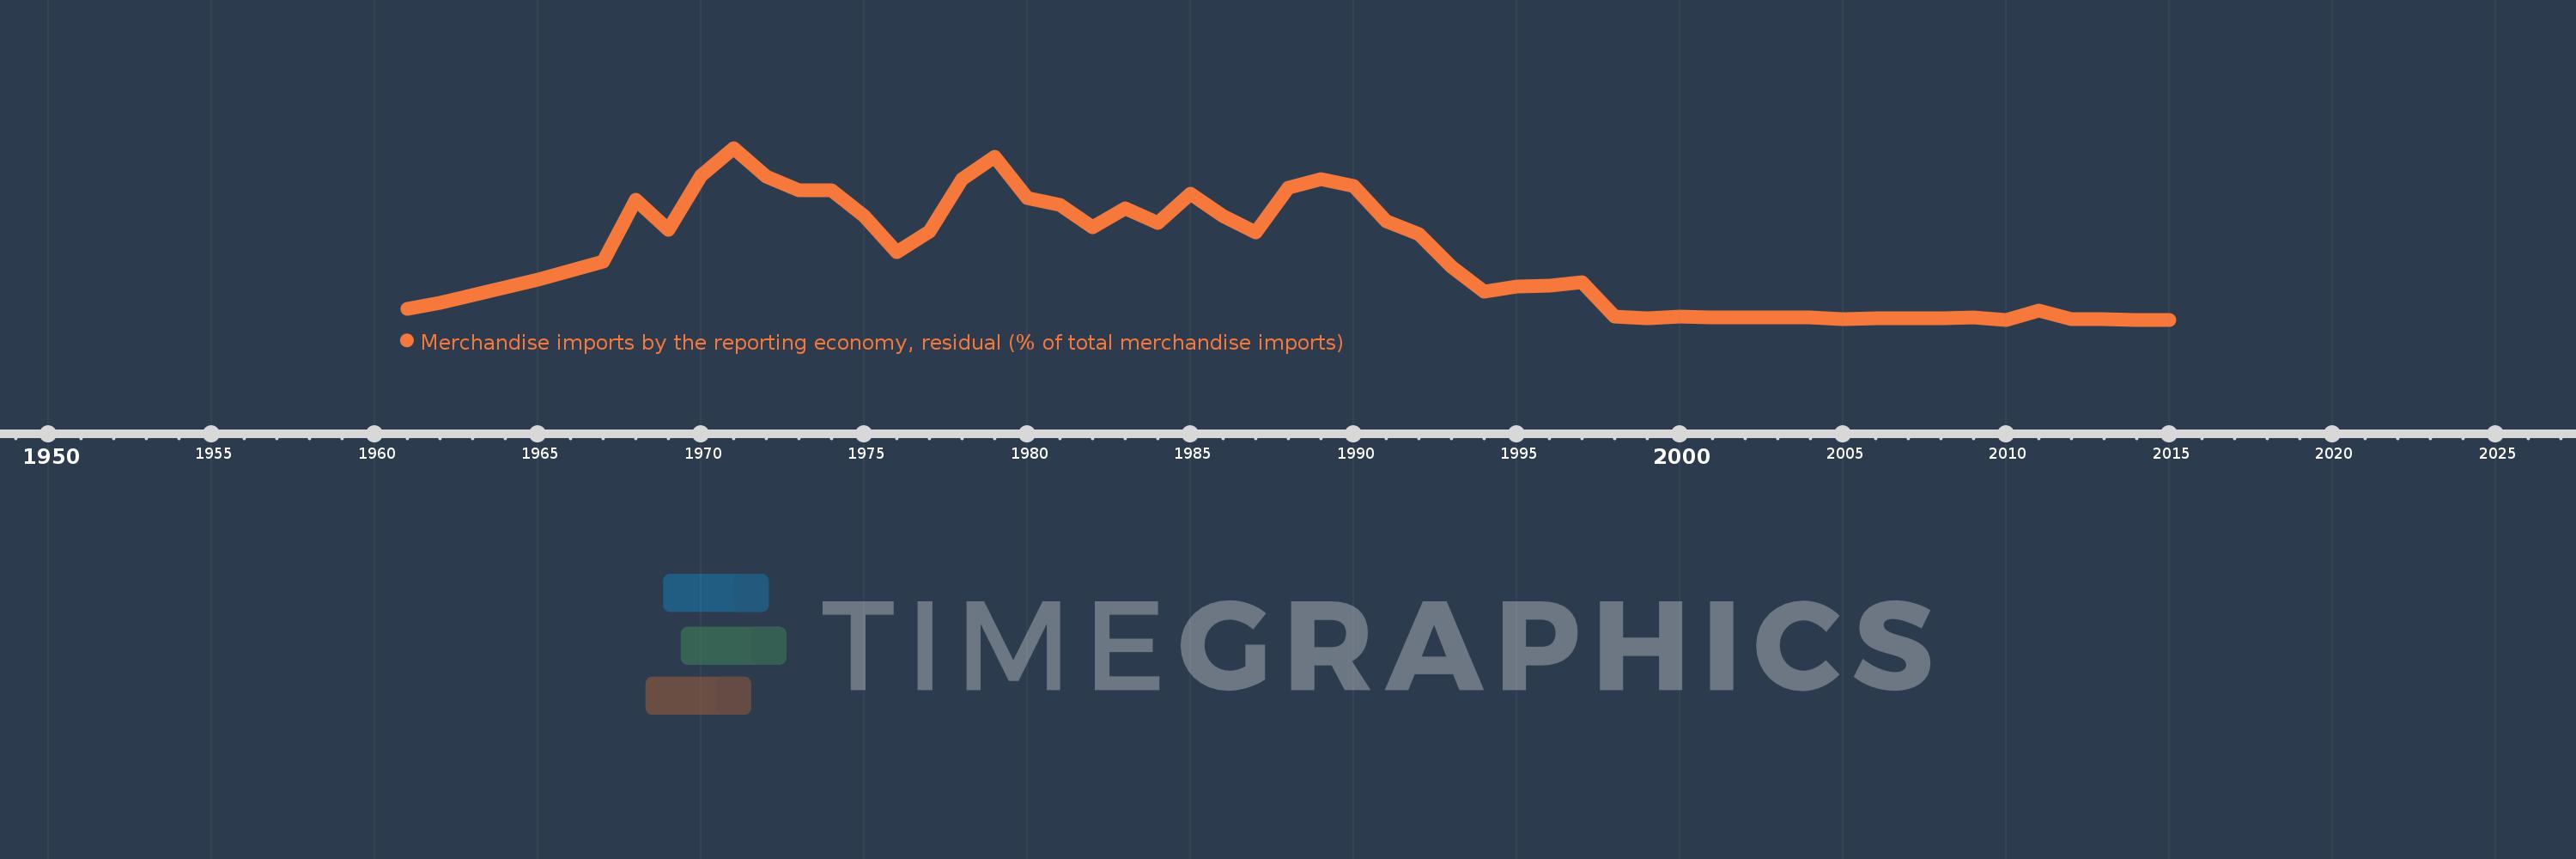
Merchandise imports by the reporting economy, residual (% of total merchandise imports)
2015,2014,2013,2012,2011,2010,2009,2008,2007,2006,2005,2004,2003,2002,2001,2000,1999,1998,1997,1996,1995,1994,1993,1992,1991,1990,1989,1988,1987,1986,1985,1984,1983,1982,1981,1980,1979,1978,1977,1976,1975,1974,1973,1972,1971,1970,1969,1968,1967,1965,1962,1961
This statistics in other country:
AfghanistanAlbaniaAlgeriaAmerican SamoaAngolaAntigua and BarbudaArab WorldArgentinaArmeniaArubaAustraliaAustriaAzerbaijanBahamas, TheBahrainBangladeshBarbadosBelarusBelgiumBelizeBeninBermudaBoliviaBosnia and HerzegovinaBrazilBrunei DarussalamBulgariaBurkina FasoBurundiCabo VerdeCambodiaCameroonCanadaCaribbean small statesCentral African RepublicCentral Europe and the BalticsChadChileChinaColombiaComorosCongo, Dem. Rep.Congo, Rep.Costa RicaCote d'IvoireCroatiaCubaCyprusCzech RepublicDenmarkDjiboutiDominicaDominican RepublicEarly-demographic dividendEast Asia & PacificEast Asia & Pacific (excluding high income)East Asia & Pacific (IDA & IBRD countries)EcuadorEgypt, Arab Rep.El SalvadorEquatorial GuineaEstoniaEthiopiaEuro areaEurope & Central AsiaEurope & Central Asia (excluding high income)Europe & Central Asia (IDA & IBRD countries)European UnionFaroe IslandsFijiFinlandFragile and conflict affected situationsFranceFrench PolynesiaGabonGambia, TheGeorgiaGermanyGhanaGibraltarGreeceGreenlandGrenadaGuamGuatemalaGuineaGuinea-BissauGuyanaHaitiHeavily indebted poor countries (HIPC)High incomeHondurasHong Kong SAR, ChinaHungaryIBRD onlyIcelandIDA & IBRD totalIDA blendIDA onlyIDA totalIndiaIndonesiaIran, Islamic Rep.IraqIrelandIsraelItalyJamaicaJapanJordanKazakhstanKenyaKiribatiKorea, Dem. People’s Rep.Korea, Rep.KosovoKuwaitKyrgyz RepublicLao PDRLate-demographic dividendLatin America & Caribbean Latin America & Caribbean (excluding high income)Latin America & the Caribbean (IDA & IBRD countries)LatviaLeast developed countries: UN classificationLebanonLiberiaLibyaLithuaniaLow & middle incomeLow incomeLower middle incomeLuxembourgMacao SAR, ChinaMacedonia, FYRMadagascarMalawiMalaysiaMaldivesMaliMaltaMauritaniaMauritiusMexicoMiddle East & North AfricaMiddle East & North Africa (excluding high income)Middle East & North Africa (IDA & IBRD countries)Middle incomeMoldovaMongoliaMontenegroMoroccoMozambiqueMyanmarNauruNepalNetherlandsNew CaledoniaNew ZealandNicaraguaNigerNigeriaNorth AmericaNorwayOECD membersOmanOther small statesPacific island small statesPakistanPanamaPapua New GuineaParaguayPeruPhilippinesPolandPortugalPost-demographic dividendPre-demographic dividendQatarRomaniaRussian FederationRwandaSamoaSao Tome and PrincipeSaudi ArabiaSenegalSerbiaSeychellesSierra LeoneSingaporeSlovak RepublicSloveniaSmall statesSolomon IslandsSomaliaSouth AfricaSouth AsiaSouth Asia (IDA & IBRD)SpainSri LankaSt. Kitts and NevisSt. LuciaSt. Vincent and the GrenadinesSub-Saharan Africa Sub-Saharan Africa (excluding high income)Sub-Saharan Africa (IDA & IBRD countries)SudanSurinameSwedenSwitzerlandSyrian Arab RepublicTajikistanTanzaniaThailandTogoTongaTrinidad and TobagoTunisiaTurkeyTurkmenistanTuvaluUgandaUkraineUnited Arab EmiratesUnited KingdomUnited StatesUpper middle incomeUruguayUzbekistanVanuatuVenezuela, RBVietnamWorldYemen, Rep.ZambiaZimbabwe Timeline:
This timeline shows a graph from 1961 to 2015 of Algeria. No data until 1960. Number of actual observations by date: 52.
Source name:
World Development Indicators
Source organization:
World Bank staff estimates based data from International Monetary Fund's Direction of Trade database.
Categories, topics:
Private Sector, Trade
Last updated:
apr 23, 2017
Indicators value changes by year
Maximum:
12.626
jan 1, 1971
At the date of observation
Value
Absolute change
Change from previous value
jan 1, 1961
0.778
+0.778
0.0%
jan 1, 1962
1.227
+0.449
57.76%
jan 1, 1965
2.924
+1.697
138.34%
jan 1, 1967
4.275
+1.351
46.18%
jan 1, 1968
8.843
+4.568
106.87%
jan 1, 1969
6.59
-2.254
-25.48%
jan 1, 1970
10.6
+4.011
60.86%
jan 1, 1971
12.626
+2.025
19.11%
jan 1, 1972
10.512
-2.113
-16.74%
jan 1, 1973
9.498
-1.014
-9.65%
jan 1, 1974
9.503
+0.005
0.06%
jan 1, 1975
7.615
-1.888
-19.86%
jan 1, 1976
4.978
-2.638
-34.64%
jan 1, 1977
6.511
+1.534
30.82%
jan 1, 1978
10.343
+3.831
58.84%
jan 1, 1979
11.965
+1.622
15.68%
jan 1, 1980
8.917
-3.048
-25.48%
jan 1, 1981
8.44
-0.477
-5.35%
jan 1, 1982
6.789
-1.651
-19.56%
jan 1, 1983
8.206
+1.417
20.87%
jan 1, 1984
7.137
-1.069
-13.03%
jan 1, 1985
9.278
+2.141
30.0%
jan 1, 1986
7.592
-1.686
-18.17%
jan 1, 1987
6.397
-1.194
-15.73%
jan 1, 1988
9.673
+3.276
51.2%
jan 1, 1989
10.361
+0.687
7.11%
jan 1, 1990
9.821
-0.539
-5.2%
jan 1, 1991
7.268
-2.554
-26.0%
jan 1, 1992
6.307
-0.961
-13.22%
jan 1, 1993
3.9
-2.406
-38.16%
jan 1, 1994
2.051
-1.849
-47.4%
jan 1, 1995
2.419
+0.368
17.92%
jan 1, 1996
2.498
+0.079
3.26%
jan 1, 1997
2.75
+0.252
10.08%
jan 1, 1998
0.217
-2.533
-92.11%
jan 1, 1999
0.126
-0.091
-42.05%
jan 1, 2000
0.213
+0.087
69.27%
jan 1, 2001
0.165
-0.047
-22.23%
jan 1, 2002
0.184
+0.018
11.1%
jan 1, 2003
0.171
-0.013
-6.97%
jan 1, 2004
0.146
-0.025
-14.53%
jan 1, 2005
0.075
-0.071
-48.73%
jan 1, 2006
0.11
+0.035
47.27%
jan 1, 2007
0.082
-0.028
-25.47%
jan 1, 2008
0.137
+0.055
66.3%
jan 1, 2009
0.139
+0.002
1.37%
jan 1, 2010
0.0
-0.139
-99.93%
jan 1, 2011
0.697
+0.697
694.6K%
jan 1, 2012
0.014
-0.684
-98.05%
jan 1, 2013
0.015
+0.002
11.9%
jan 1, 2014
0.002
-0.013
-88.62%
jan 1, 2015
0.004
+0.002
115.05%
Ranking of countries by current statistics by years


Comments: