29
/
en
AIzaSyAYiBZKx7MnpbEhh9jyipgxe19OcubqV5w
April 1, 2024
140677
Ghana
GHA
true
2
1
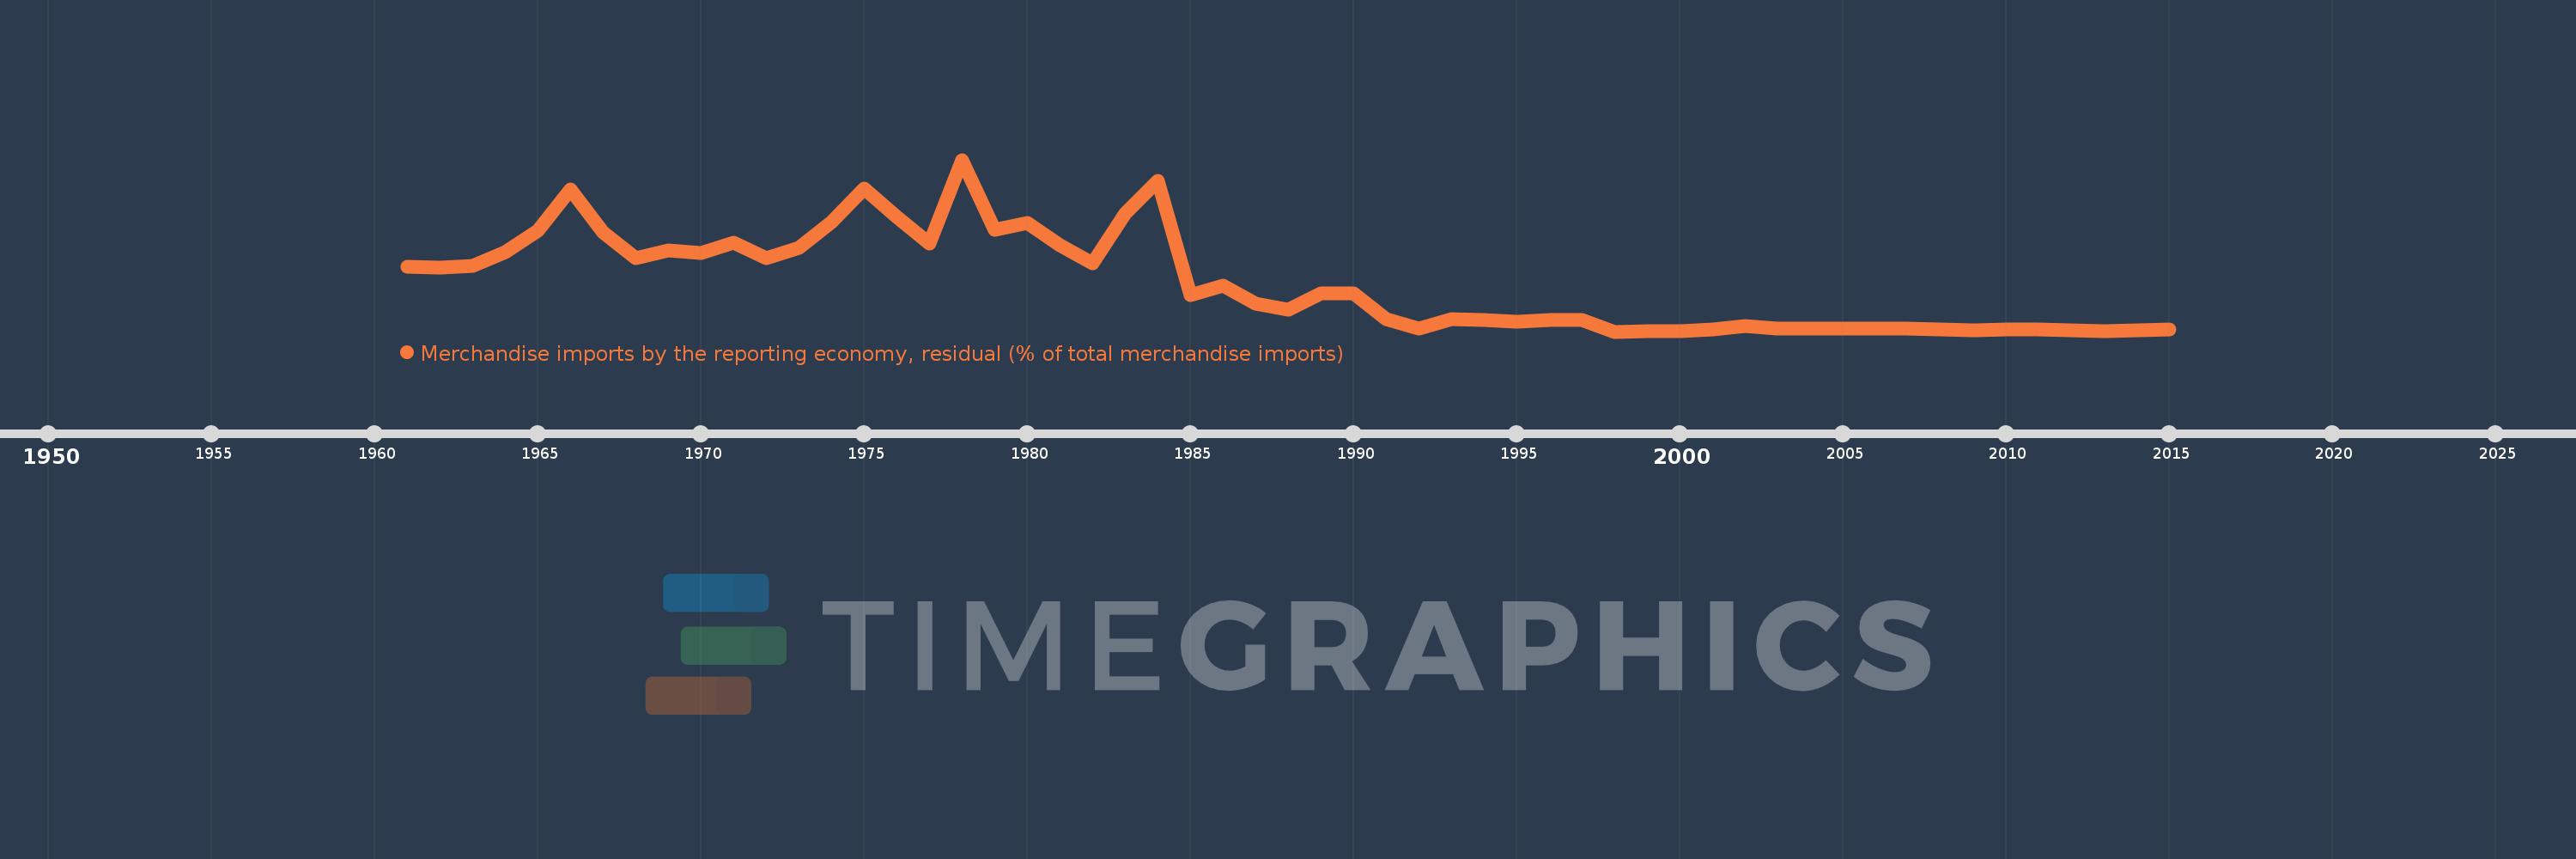
Merchandise imports by the reporting economy, residual (% of total merchandise imports)
2015,2014,2013,2012,2011,2010,2009,2008,2007,2006,2005,2004,2003,2002,2001,2000,1999,1998,1997,1996,1995,1994,1993,1992,1991,1990,1989,1988,1987,1986,1985,1984,1983,1982,1981,1980,1979,1978,1977,1976,1975,1974,1973,1972,1971,1970,1969,1968,1967,1966,1965,1964,1963,1962,1961
This statistics in other country:
AfghanistanAlbaniaAlgeriaAmerican SamoaAngolaAntigua and BarbudaArab WorldArgentinaArmeniaArubaAustraliaAustriaAzerbaijanBahamas, TheBahrainBangladeshBarbadosBelarusBelgiumBelizeBeninBermudaBoliviaBosnia and HerzegovinaBrazilBrunei DarussalamBulgariaBurkina FasoBurundiCabo VerdeCambodiaCameroonCanadaCaribbean small statesCentral African RepublicCentral Europe and the BalticsChadChileChinaColombiaComorosCongo, Dem. Rep.Congo, Rep.Costa RicaCote d'IvoireCroatiaCubaCyprusCzech RepublicDenmarkDjiboutiDominicaDominican RepublicEarly-demographic dividendEast Asia & PacificEast Asia & Pacific (excluding high income)East Asia & Pacific (IDA & IBRD countries)EcuadorEgypt, Arab Rep.El SalvadorEquatorial GuineaEstoniaEthiopiaEuro areaEurope & Central AsiaEurope & Central Asia (excluding high income)Europe & Central Asia (IDA & IBRD countries)European UnionFaroe IslandsFijiFinlandFragile and conflict affected situationsFranceFrench PolynesiaGabonGambia, TheGeorgiaGermanyGhanaGibraltarGreeceGreenlandGrenadaGuamGuatemalaGuineaGuinea-BissauGuyanaHaitiHeavily indebted poor countries (HIPC)High incomeHondurasHong Kong SAR, ChinaHungaryIBRD onlyIcelandIDA & IBRD totalIDA blendIDA onlyIDA totalIndiaIndonesiaIran, Islamic Rep.IraqIrelandIsraelItalyJamaicaJapanJordanKazakhstanKenyaKiribatiKorea, Dem. People’s Rep.Korea, Rep.KosovoKuwaitKyrgyz RepublicLao PDRLate-demographic dividendLatin America & Caribbean Latin America & Caribbean (excluding high income)Latin America & the Caribbean (IDA & IBRD countries)LatviaLeast developed countries: UN classificationLebanonLiberiaLibyaLithuaniaLow & middle incomeLow incomeLower middle incomeLuxembourgMacao SAR, ChinaMacedonia, FYRMadagascarMalawiMalaysiaMaldivesMaliMaltaMauritaniaMauritiusMexicoMiddle East & North AfricaMiddle East & North Africa (excluding high income)Middle East & North Africa (IDA & IBRD countries)Middle incomeMoldovaMongoliaMontenegroMoroccoMozambiqueMyanmarNauruNepalNetherlandsNew CaledoniaNew ZealandNicaraguaNigerNigeriaNorth AmericaNorwayOECD membersOmanOther small statesPacific island small statesPakistanPanamaPapua New GuineaParaguayPeruPhilippinesPolandPortugalPost-demographic dividendPre-demographic dividendQatarRomaniaRussian FederationRwandaSamoaSao Tome and PrincipeSaudi ArabiaSenegalSerbiaSeychellesSierra LeoneSingaporeSlovak RepublicSloveniaSmall statesSolomon IslandsSomaliaSouth AfricaSouth AsiaSouth Asia (IDA & IBRD)SpainSri LankaSt. Kitts and NevisSt. LuciaSt. Vincent and the GrenadinesSub-Saharan Africa Sub-Saharan Africa (excluding high income)Sub-Saharan Africa (IDA & IBRD countries)SudanSurinameSwedenSwitzerlandSyrian Arab RepublicTajikistanTanzaniaThailandTogoTongaTrinidad and TobagoTunisiaTurkeyTurkmenistanTuvaluUgandaUkraineUnited Arab EmiratesUnited KingdomUnited StatesUpper middle incomeUruguayUzbekistanVanuatuVenezuela, RBVietnamWorldYemen, Rep.ZambiaZimbabwe Timeline:
This timeline shows a graph from 1961 to 2015 of Ghana. No data until 1960. Number of actual observations by date: 55.
Source name:
World Development Indicators
Source organization:
World Bank staff estimates based data from International Monetary Fund's Direction of Trade database.
Categories, topics:
Private Sector, Trade
Last updated:
apr 23, 2017
Indicators value changes by year
Maximum:
27.748
jan 1, 1978
At the date of observation
Value
Absolute change
Change from previous value
jan 1, 1961
10.771
+10.771
0.0%
jan 1, 1962
10.732
-0.038
-0.36%
jan 1, 1963
11.014
+0.282
2.63%
jan 1, 1964
13.07
+2.055
18.66%
jan 1, 1965
16.52
+3.45
26.4%
jan 1, 1966
23.058
+6.538
39.58%
jan 1, 1967
16.197
-6.861
-29.76%
jan 1, 1968
12.15
-4.047
-24.99%
jan 1, 1969
13.353
+1.203
9.9%
jan 1, 1970
12.939
-0.413
-3.1%
jan 1, 1971
14.642
+1.702
13.15%
jan 1, 1972
12.113
-2.529
-17.27%
jan 1, 1973
13.791
+1.679
13.86%
jan 1, 1974
17.944
+4.153
30.11%
jan 1, 1975
23.124
+5.18
28.87%
jan 1, 1976
18.744
-4.381
-18.94%
jan 1, 1977
14.495
-4.249
-22.67%
jan 1, 1978
27.748
+13.253
91.43%
jan 1, 1979
16.629
-11.119
-40.07%
jan 1, 1980
17.709
+1.081
6.5%
jan 1, 1981
14.155
-3.554
-20.07%
jan 1, 1982
11.304
-2.851
-20.14%
jan 1, 1983
19.213
+7.909
69.96%
jan 1, 1984
24.369
+5.156
26.83%
jan 1, 1985
6.337
-18.032
-73.99%
jan 1, 1986
7.883
+1.546
24.39%
jan 1, 1987
4.91
-2.973
-37.71%
jan 1, 1988
4.011
-0.899
-18.31%
jan 1, 1989
6.556
+2.545
63.45%
jan 1, 1990
6.556
+0.0
0.0%
jan 1, 1991
2.488
-4.068
-62.05%
jan 1, 1992
1.08
-1.408
-56.58%
jan 1, 1993
2.549
+1.469
135.99%
jan 1, 1994
2.403
-0.146
-5.74%
jan 1, 1995
2.121
-0.282
-11.75%
jan 1, 1996
2.383
+0.263
12.39%
jan 1, 1997
2.334
-0.049
-2.07%
jan 1, 1998
0.54
-1.794
-76.87%
jan 1, 1999
0.603
+0.063
11.66%
jan 1, 2000
0.671
+0.068
11.33%
jan 1, 2001
0.875
+0.204
30.38%
jan 1, 2002
1.364
+0.489
55.88%
jan 1, 2003
0.997
-0.367
-26.89%
jan 1, 2004
0.96
-0.037
-3.73%
jan 1, 2005
0.95
-0.011
-1.1%
jan 1, 2006
0.956
+0.007
0.73%
jan 1, 2007
0.998
+0.041
4.31%
jan 1, 2008
0.911
-0.087
-8.73%
jan 1, 2009
0.809
-0.101
-11.14%
jan 1, 2010
0.841
+0.032
3.94%
jan 1, 2011
0.865
+0.023
2.79%
jan 1, 2012
0.725
-0.139
-16.13%
jan 1, 2013
0.618
-0.107
-14.78%
jan 1, 2014
0.685
+0.067
10.85%
jan 1, 2015
0.823
+0.138
20.09%
Ranking of countries by current statistics by years


Comments: