29
/
en
AIzaSyAYiBZKx7MnpbEhh9jyipgxe19OcubqV5w
April 1, 2024
167779
Kenya
KEN
true
2
1
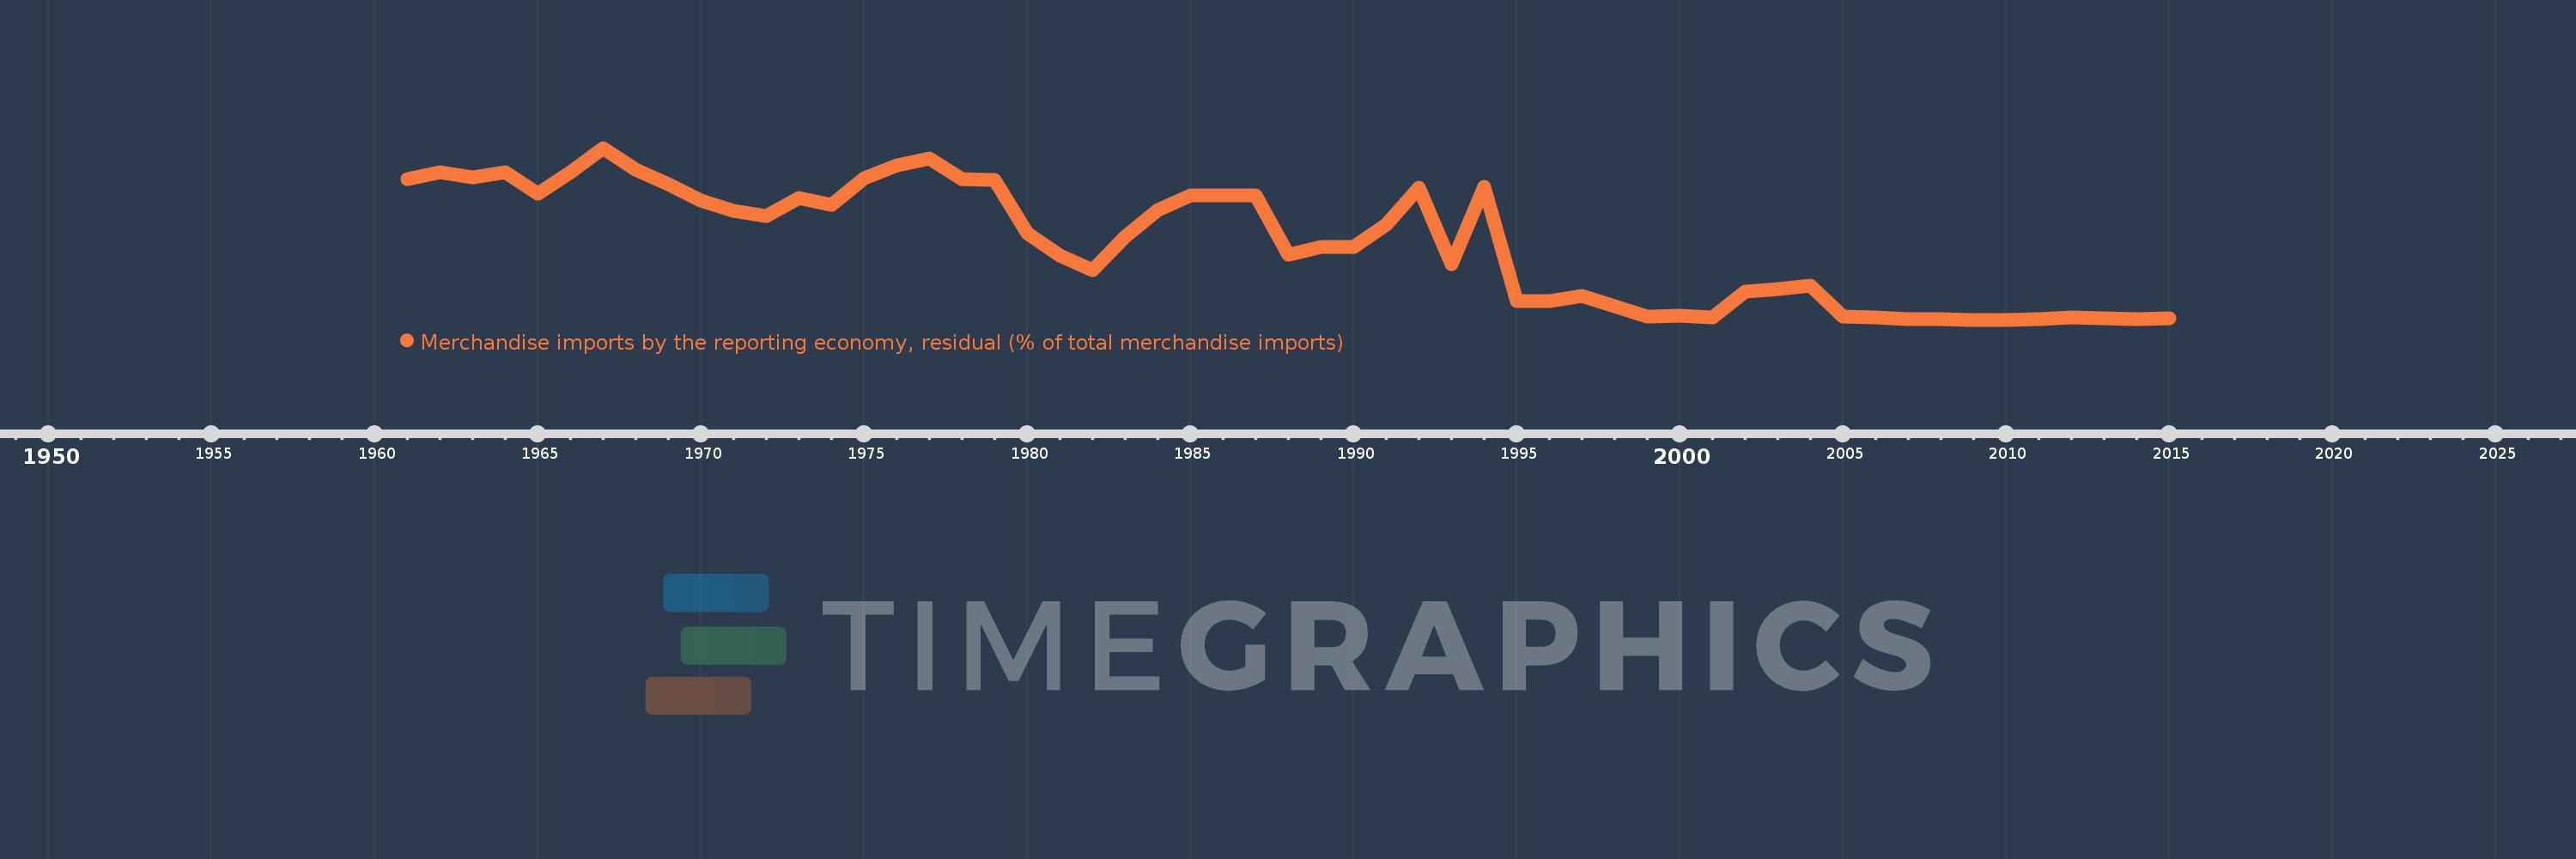
Merchandise imports by the reporting economy, residual (% of total merchandise imports)
2015,2014,2013,2012,2011,2010,2009,2008,2007,2006,2005,2004,2003,2002,2001,2000,1999,1998,1997,1996,1995,1994,1993,1992,1991,1990,1989,1988,1987,1986,1985,1984,1983,1982,1981,1980,1979,1978,1977,1976,1975,1974,1973,1972,1971,1970,1969,1968,1967,1966,1965,1964,1963,1962,1961
This statistics in other country:
AfghanistanAlbaniaAlgeriaAmerican SamoaAngolaAntigua and BarbudaArab WorldArgentinaArmeniaArubaAustraliaAustriaAzerbaijanBahamas, TheBahrainBangladeshBarbadosBelarusBelgiumBelizeBeninBermudaBoliviaBosnia and HerzegovinaBrazilBrunei DarussalamBulgariaBurkina FasoBurundiCabo VerdeCambodiaCameroonCanadaCaribbean small statesCentral African RepublicCentral Europe and the BalticsChadChileChinaColombiaComorosCongo, Dem. Rep.Congo, Rep.Costa RicaCote d'IvoireCroatiaCubaCyprusCzech RepublicDenmarkDjiboutiDominicaDominican RepublicEarly-demographic dividendEast Asia & PacificEast Asia & Pacific (excluding high income)East Asia & Pacific (IDA & IBRD countries)EcuadorEgypt, Arab Rep.El SalvadorEquatorial GuineaEstoniaEthiopiaEuro areaEurope & Central AsiaEurope & Central Asia (excluding high income)Europe & Central Asia (IDA & IBRD countries)European UnionFaroe IslandsFijiFinlandFragile and conflict affected situationsFranceFrench PolynesiaGabonGambia, TheGeorgiaGermanyGhanaGibraltarGreeceGreenlandGrenadaGuamGuatemalaGuineaGuinea-BissauGuyanaHaitiHeavily indebted poor countries (HIPC)High incomeHondurasHong Kong SAR, ChinaHungaryIBRD onlyIcelandIDA & IBRD totalIDA blendIDA onlyIDA totalIndiaIndonesiaIran, Islamic Rep.IraqIrelandIsraelItalyJamaicaJapanJordanKazakhstanKenyaKiribatiKorea, Dem. People’s Rep.Korea, Rep.KosovoKuwaitKyrgyz RepublicLao PDRLate-demographic dividendLatin America & Caribbean Latin America & Caribbean (excluding high income)Latin America & the Caribbean (IDA & IBRD countries)LatviaLeast developed countries: UN classificationLebanonLiberiaLibyaLithuaniaLow & middle incomeLow incomeLower middle incomeLuxembourgMacao SAR, ChinaMacedonia, FYRMadagascarMalawiMalaysiaMaldivesMaliMaltaMauritaniaMauritiusMexicoMiddle East & North AfricaMiddle East & North Africa (excluding high income)Middle East & North Africa (IDA & IBRD countries)Middle incomeMoldovaMongoliaMontenegroMoroccoMozambiqueMyanmarNauruNepalNetherlandsNew CaledoniaNew ZealandNicaraguaNigerNigeriaNorth AmericaNorwayOECD membersOmanOther small statesPacific island small statesPakistanPanamaPapua New GuineaParaguayPeruPhilippinesPolandPortugalPost-demographic dividendPre-demographic dividendQatarRomaniaRussian FederationRwandaSamoaSao Tome and PrincipeSaudi ArabiaSenegalSerbiaSeychellesSierra LeoneSingaporeSlovak RepublicSloveniaSmall statesSolomon IslandsSomaliaSouth AfricaSouth AsiaSouth Asia (IDA & IBRD)SpainSri LankaSt. Kitts and NevisSt. LuciaSt. Vincent and the GrenadinesSub-Saharan Africa Sub-Saharan Africa (excluding high income)Sub-Saharan Africa (IDA & IBRD countries)SudanSurinameSwedenSwitzerlandSyrian Arab RepublicTajikistanTanzaniaThailandTogoTongaTrinidad and TobagoTunisiaTurkeyTurkmenistanTuvaluUgandaUkraineUnited Arab EmiratesUnited KingdomUnited StatesUpper middle incomeUruguayUzbekistanVanuatuVenezuela, RBVietnamWorldYemen, Rep.ZambiaZimbabwe Timeline:
This timeline shows a graph from 1961 to 2015 of Kenya. No data until 1960. Number of actual observations by date: 55.
Source name:
World Development Indicators
Source organization:
World Bank staff estimates based data from International Monetary Fund's Direction of Trade database.
Categories, topics:
Private Sector, Trade
Last updated:
apr 23, 2017
Indicators value changes by year
Maximum:
25.508
jan 1, 1967
At the date of observation
Value
Absolute change
Change from previous value
jan 1, 1961
20.873
+20.873
0.0%
jan 1, 1962
21.907
+1.034
4.95%
jan 1, 1963
21.171
-0.736
-3.36%
jan 1, 1964
21.841
+0.67
3.16%
jan 1, 1965
18.729
-3.112
-14.25%
jan 1, 1966
21.889
+3.16
16.87%
jan 1, 1967
25.508
+3.619
16.53%
jan 1, 1968
22.282
-3.227
-12.65%
jan 1, 1969
20.104
-2.178
-9.78%
jan 1, 1970
17.634
-2.47
-12.29%
jan 1, 1971
16.119
-1.515
-8.59%
jan 1, 1972
15.426
-0.693
-4.3%
jan 1, 1973
18.017
+2.59
16.79%
jan 1, 1974
17.041
-0.976
-5.42%
jan 1, 1975
20.965
+3.925
23.03%
jan 1, 1976
22.961
+1.996
9.52%
jan 1, 1977
23.952
+0.99
4.31%
jan 1, 1978
20.823
-3.128
-13.06%
jan 1, 1979
20.742
-0.081
-0.39%
jan 1, 1980
12.915
-7.827
-37.73%
jan 1, 1981
9.542
-3.374
-26.12%
jan 1, 1982
7.336
-2.206
-23.12%
jan 1, 1983
12.355
+5.019
68.42%
jan 1, 1984
16.283
+3.927
31.78%
jan 1, 1985
18.434
+2.151
13.21%
jan 1, 1986
18.434
0.0
0.0%
jan 1, 1987
18.434
+0.0
0.0%
jan 1, 1988
9.693
-8.741
-47.42%
jan 1, 1989
10.866
+1.173
12.1%
jan 1, 1990
10.866
0.0
0.0%
jan 1, 1991
14.15
+3.283
30.22%
jan 1, 1992
19.666
+5.516
38.99%
jan 1, 1993
8.229
-11.438
-58.16%
jan 1, 1994
19.756
+11.528
140.1%
jan 1, 1995
2.778
-16.978
-85.94%
jan 1, 1996
2.77
-0.008
-0.29%
jan 1, 1997
3.525
+0.755
27.25%
jan 1, 1998
1.97
-1.555
-44.11%
jan 1, 1999
0.512
-1.459
-74.04%
jan 1, 2000
0.576
+0.064
12.56%
jan 1, 2001
0.347
-0.229
-39.69%
jan 1, 2002
4.236
+3.889
1.12K%
jan 1, 2003
4.605
+0.369
8.72%
jan 1, 2004
5.12
+0.515
11.17%
jan 1, 2005
0.43
-4.69
-91.61%
jan 1, 2006
0.328
-0.101
-23.61%
jan 1, 2007
0.127
-0.201
-61.25%
jan 1, 2008
0.07
-0.057
-44.67%
jan 1, 2009
0.025
-0.045
-63.92%
jan 1, 2010
0.022
-0.004
-14.56%
jan 1, 2011
0.122
+0.1
461.71%
jan 1, 2012
0.417
+0.295
242.49%
jan 1, 2013
0.246
-0.171
-41.06%
jan 1, 2014
0.053
-0.193
-78.37%
jan 1, 2015
0.194
+0.14
264.01%
Ranking of countries by current statistics by years


Comments: