29
/
en
AIzaSyAYiBZKx7MnpbEhh9jyipgxe19OcubqV5w
April 1, 2024
63737
Afghanistan
AFG
true
2
1
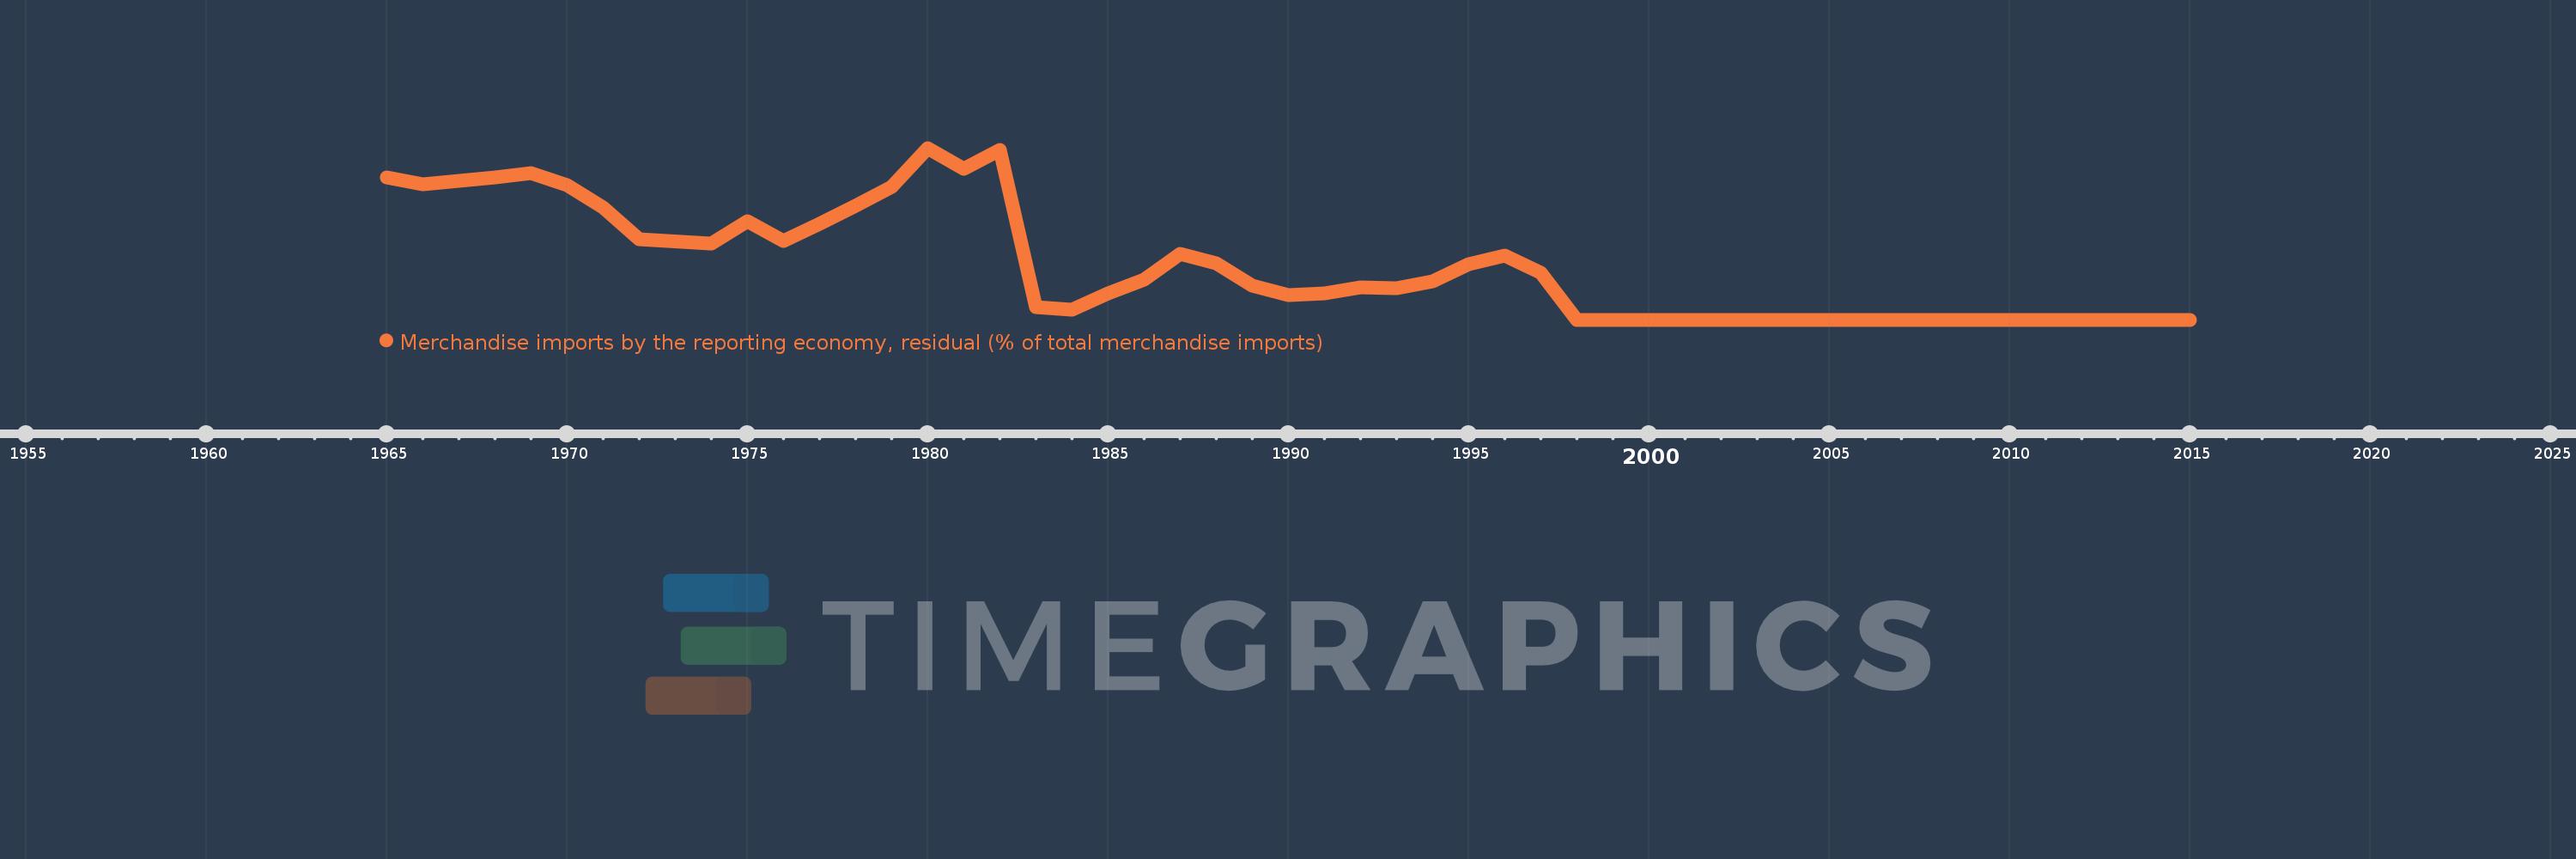
Merchandise imports by the reporting economy, residual (% of total merchandise imports)
2015,2014,2013,2012,2011,2010,2009,2008,2007,2006,2005,2004,2003,2002,2001,2000,1999,1998,1997,1996,1995,1994,1993,1992,1991,1990,1989,1988,1987,1986,1985,1984,1983,1982,1981,1980,1979,1978,1977,1976,1975,1974,1972,1971,1970,1969,1968,1966,1965
This statistics in other country:
AfghanistanAlbaniaAlgeriaAmerican SamoaAngolaAntigua and BarbudaArab WorldArgentinaArmeniaArubaAustraliaAustriaAzerbaijanBahamas, TheBahrainBangladeshBarbadosBelarusBelgiumBelizeBeninBermudaBoliviaBosnia and HerzegovinaBrazilBrunei DarussalamBulgariaBurkina FasoBurundiCabo VerdeCambodiaCameroonCanadaCaribbean small statesCentral African RepublicCentral Europe and the BalticsChadChileChinaColombiaComorosCongo, Dem. Rep.Congo, Rep.Costa RicaCote d'IvoireCroatiaCubaCyprusCzech RepublicDenmarkDjiboutiDominicaDominican RepublicEarly-demographic dividendEast Asia & PacificEast Asia & Pacific (excluding high income)East Asia & Pacific (IDA & IBRD countries)EcuadorEgypt, Arab Rep.El SalvadorEquatorial GuineaEstoniaEthiopiaEuro areaEurope & Central AsiaEurope & Central Asia (excluding high income)Europe & Central Asia (IDA & IBRD countries)European UnionFaroe IslandsFijiFinlandFragile and conflict affected situationsFranceFrench PolynesiaGabonGambia, TheGeorgiaGermanyGhanaGibraltarGreeceGreenlandGrenadaGuamGuatemalaGuineaGuinea-BissauGuyanaHaitiHeavily indebted poor countries (HIPC)High incomeHondurasHong Kong SAR, ChinaHungaryIBRD onlyIcelandIDA & IBRD totalIDA blendIDA onlyIDA totalIndiaIndonesiaIran, Islamic Rep.IraqIrelandIsraelItalyJamaicaJapanJordanKazakhstanKenyaKiribatiKorea, Dem. People’s Rep.Korea, Rep.KosovoKuwaitKyrgyz RepublicLao PDRLate-demographic dividendLatin America & Caribbean Latin America & Caribbean (excluding high income)Latin America & the Caribbean (IDA & IBRD countries)LatviaLeast developed countries: UN classificationLebanonLiberiaLibyaLithuaniaLow & middle incomeLow incomeLower middle incomeLuxembourgMacao SAR, ChinaMacedonia, FYRMadagascarMalawiMalaysiaMaldivesMaliMaltaMauritaniaMauritiusMexicoMiddle East & North AfricaMiddle East & North Africa (excluding high income)Middle East & North Africa (IDA & IBRD countries)Middle incomeMoldovaMongoliaMontenegroMoroccoMozambiqueMyanmarNauruNepalNetherlandsNew CaledoniaNew ZealandNicaraguaNigerNigeriaNorth AmericaNorwayOECD membersOmanOther small statesPacific island small statesPakistanPanamaPapua New GuineaParaguayPeruPhilippinesPolandPortugalPost-demographic dividendPre-demographic dividendQatarRomaniaRussian FederationRwandaSamoaSao Tome and PrincipeSaudi ArabiaSenegalSerbiaSeychellesSierra LeoneSingaporeSlovak RepublicSloveniaSmall statesSolomon IslandsSomaliaSouth AfricaSouth AsiaSouth Asia (IDA & IBRD)SpainSri LankaSt. Kitts and NevisSt. LuciaSt. Vincent and the GrenadinesSub-Saharan Africa Sub-Saharan Africa (excluding high income)Sub-Saharan Africa (IDA & IBRD countries)SudanSurinameSwedenSwitzerlandSyrian Arab RepublicTajikistanTanzaniaThailandTogoTongaTrinidad and TobagoTunisiaTurkeyTurkmenistanTuvaluUgandaUkraineUnited Arab EmiratesUnited KingdomUnited StatesUpper middle incomeUruguayUzbekistanVanuatuVenezuela, RBVietnamWorldYemen, Rep.ZambiaZimbabwe Timeline:
This timeline shows a graph from 1965 to 2015 of Afghanistan. No data until 1964. Number of actual observations by date: 49.
Source name:
World Development Indicators
Source organization:
World Bank staff estimates based data from International Monetary Fund's Direction of Trade database.
Categories, topics:
Private Sector, Trade
Last updated:
apr 23, 2017
Indicators value changes by year
At the date of observation
Value
Absolute change
Change from previous value
jan 1, 1965
57.123
+57.123
0.0%
jan 1, 1966
54.37
-2.753
-4.82%
jan 1, 1968
57.228
+2.858
5.26%
jan 1, 1969
58.665
+1.437
2.51%
jan 1, 1970
54.136
-4.529
-7.72%
jan 1, 1971
45.034
-9.102
-16.81%
jan 1, 1972
32.425
-12.608
-28.0%
jan 1, 1974
30.572
-1.854
-5.72%
jan 1, 1975
39.35
+8.778
28.71%
jan 1, 1976
31.485
-7.864
-19.99%
jan 1, 1977
38.406
+6.921
21.98%
jan 1, 1978
45.553
+7.147
18.61%
jan 1, 1979
53.468
+7.915
17.37%
jan 1, 1980
68.91
+15.442
28.88%
jan 1, 1981
60.669
-8.24
-11.96%
jan 1, 1982
68.07
+7.4
12.2%
jan 1, 1983
5.159
-62.91
-92.42%
jan 1, 1984
4.112
-1.048
-20.31%
jan 1, 1985
10.509
+6.398
155.59%
jan 1, 1986
16.114
+5.605
53.33%
jan 1, 1987
26.565
+10.45
64.85%
jan 1, 1988
22.589
-3.976
-14.97%
jan 1, 1989
13.731
-8.858
-39.21%
jan 1, 1990
9.872
-3.859
-28.11%
jan 1, 1991
10.426
+0.554
5.62%
jan 1, 1992
13.106
+2.68
25.7%
jan 1, 1993
12.789
-0.317
-2.42%
jan 1, 1994
15.26
+2.471
19.32%
jan 1, 1995
22.396
+7.137
46.77%
jan 1, 1996
25.63
+3.234
14.44%
jan 1, 1997
18.831
-6.799
-26.53%
jan 1, 1998
0.0
-18.831
-100.0%
jan 1, 1999
0.0
0.0
-491.22%
jan 1, 2000
0.0
+0.0
-100.07%
jan 1, 2001
0.006
+0.006
65.14 trl%
jan 1, 2002
0.0
-0.006
-100.0%
jan 1, 2003
0.0
+0.0
-300.62K%
jan 1, 2004
0.0
0.0
-177.16%
jan 1, 2005
0.0
+0.0
-100.03%
jan 1, 2006
0.0
+0.0
79.91K%
jan 1, 2007
0.0
0.0
-180.09%
jan 1, 2008
0.0
+0.0
-100.12%
jan 1, 2009
0.0
+0.0
167.23K%
jan 1, 2010
0.0
0.0
-99.98%
jan 1, 2011
0.0
0.0
-100.0%
jan 1, 2013
0.0
0.0
41.27K%
jan 1, 2014
0.0
0.0
23.67%
jan 1, 2015
0.0
+0.0
-227.63%
Ranking of countries by current statistics by years


Comments: