29
/
en
AIzaSyAYiBZKx7MnpbEhh9jyipgxe19OcubqV5w
April 1, 2024
35945
High income
HIC
false
2
1
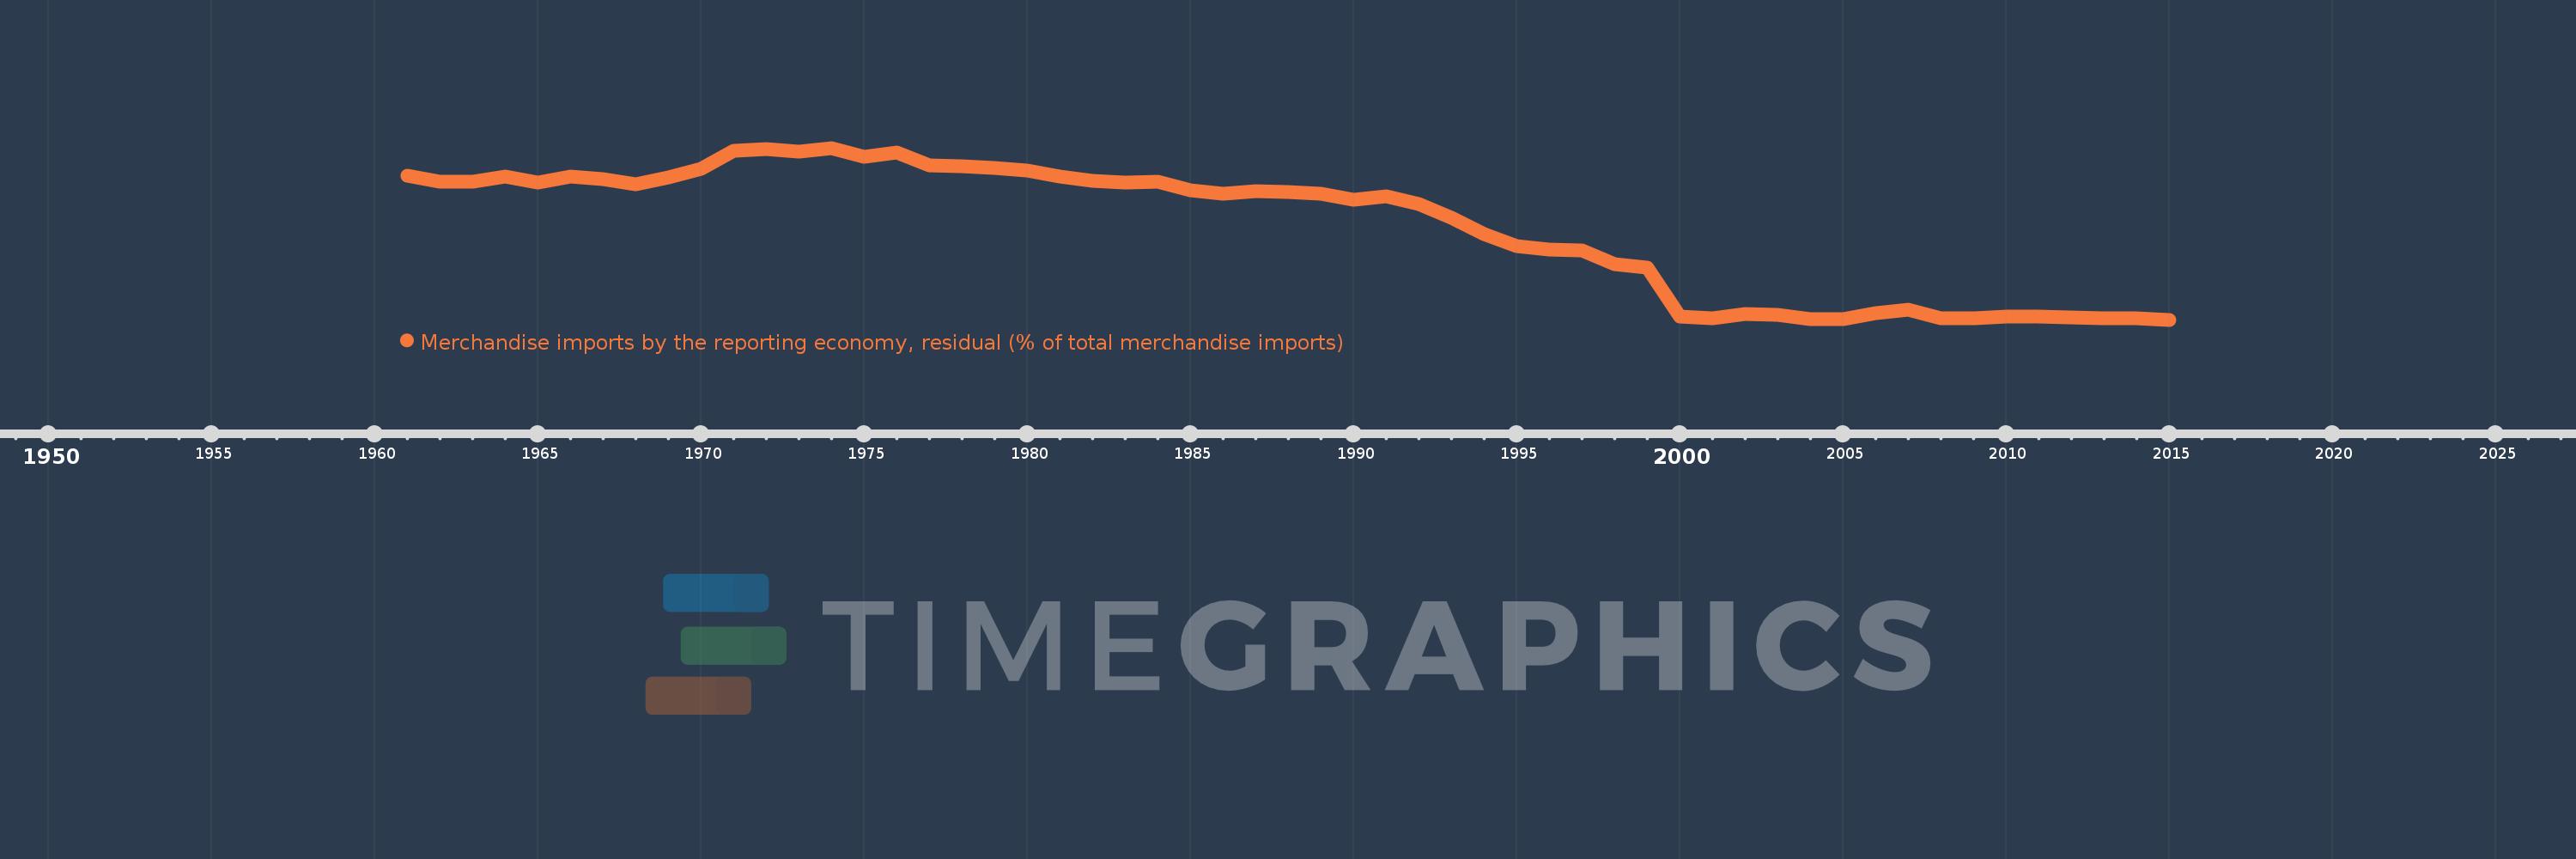
Merchandise imports by the reporting economy, residual (% of total merchandise imports)
2015,2014,2013,2012,2011,2010,2009,2008,2007,2006,2005,2004,2003,2002,2001,2000,1999,1998,1997,1996,1995,1994,1993,1992,1991,1990,1989,1988,1987,1986,1985,1984,1983,1982,1981,1980,1979,1978,1977,1976,1975,1974,1973,1972,1971,1970,1969,1968,1967,1966,1965,1964,1963,1962,1961
This statistics in other country:
AfghanistanAlbaniaAlgeriaAmerican SamoaAngolaAntigua and BarbudaArab WorldArgentinaArmeniaArubaAustraliaAustriaAzerbaijanBahamas, TheBahrainBangladeshBarbadosBelarusBelgiumBelizeBeninBermudaBoliviaBosnia and HerzegovinaBrazilBrunei DarussalamBulgariaBurkina FasoBurundiCabo VerdeCambodiaCameroonCanadaCaribbean small statesCentral African RepublicCentral Europe and the BalticsChadChileChinaColombiaComorosCongo, Dem. Rep.Congo, Rep.Costa RicaCote d'IvoireCroatiaCubaCyprusCzech RepublicDenmarkDjiboutiDominicaDominican RepublicEarly-demographic dividendEast Asia & PacificEast Asia & Pacific (excluding high income)East Asia & Pacific (IDA & IBRD countries)EcuadorEgypt, Arab Rep.El SalvadorEquatorial GuineaEstoniaEthiopiaEuro areaEurope & Central AsiaEurope & Central Asia (excluding high income)Europe & Central Asia (IDA & IBRD countries)European UnionFaroe IslandsFijiFinlandFragile and conflict affected situationsFranceFrench PolynesiaGabonGambia, TheGeorgiaGermanyGhanaGibraltarGreeceGreenlandGrenadaGuamGuatemalaGuineaGuinea-BissauGuyanaHaitiHeavily indebted poor countries (HIPC)High incomeHondurasHong Kong SAR, ChinaHungaryIBRD onlyIcelandIDA & IBRD totalIDA blendIDA onlyIDA totalIndiaIndonesiaIran, Islamic Rep.IraqIrelandIsraelItalyJamaicaJapanJordanKazakhstanKenyaKiribatiKorea, Dem. People’s Rep.Korea, Rep.KosovoKuwaitKyrgyz RepublicLao PDRLate-demographic dividendLatin America & Caribbean Latin America & Caribbean (excluding high income)Latin America & the Caribbean (IDA & IBRD countries)LatviaLeast developed countries: UN classificationLebanonLiberiaLibyaLithuaniaLow & middle incomeLow incomeLower middle incomeLuxembourgMacao SAR, ChinaMacedonia, FYRMadagascarMalawiMalaysiaMaldivesMaliMaltaMauritaniaMauritiusMexicoMiddle East & North AfricaMiddle East & North Africa (excluding high income)Middle East & North Africa (IDA & IBRD countries)Middle incomeMoldovaMongoliaMontenegroMoroccoMozambiqueMyanmarNauruNepalNetherlandsNew CaledoniaNew ZealandNicaraguaNigerNigeriaNorth AmericaNorwayOECD membersOmanOther small statesPacific island small statesPakistanPanamaPapua New GuineaParaguayPeruPhilippinesPolandPortugalPost-demographic dividendPre-demographic dividendQatarRomaniaRussian FederationRwandaSamoaSao Tome and PrincipeSaudi ArabiaSenegalSerbiaSeychellesSierra LeoneSingaporeSlovak RepublicSloveniaSmall statesSolomon IslandsSomaliaSouth AfricaSouth AsiaSouth Asia (IDA & IBRD)SpainSri LankaSt. Kitts and NevisSt. LuciaSt. Vincent and the GrenadinesSub-Saharan Africa Sub-Saharan Africa (excluding high income)Sub-Saharan Africa (IDA & IBRD countries)SudanSurinameSwedenSwitzerlandSyrian Arab RepublicTajikistanTanzaniaThailandTogoTongaTrinidad and TobagoTunisiaTurkeyTurkmenistanTuvaluUgandaUkraineUnited Arab EmiratesUnited KingdomUnited StatesUpper middle incomeUruguayUzbekistanVanuatuVenezuela, RBVietnamWorldYemen, Rep.ZambiaZimbabwe Timeline:
This timeline shows a graph from 1961 to 2015 of High income. No data until 1960. Number of actual observations by date: 55.
Source name:
World Development Indicators
Source organization:
World Bank staff estimates based data from International Monetary Fund's Direction of Trade database.
Categories, topics:
Private Sector, Trade
Last updated:
apr 23, 2017
Indicators value changes by year
At the date of observation
Value
Absolute change
Change from previous value
jan 1, 1961
7.928
+7.928
0.0%
jan 1, 1962
7.623
-0.305
-3.85%
jan 1, 1963
7.623
+0.0
0.0%
jan 1, 1964
7.854
+0.231
3.04%
jan 1, 1965
7.581
-0.273
-3.48%
jan 1, 1966
7.856
+0.275
3.63%
jan 1, 1967
7.718
-0.138
-1.76%
jan 1, 1968
7.474
-0.244
-3.16%
jan 1, 1969
7.838
+0.364
4.87%
jan 1, 1970
8.261
+0.422
5.39%
jan 1, 1971
9.174
+0.913
11.06%
jan 1, 1972
9.265
+0.091
0.99%
jan 1, 1973
9.15
-0.115
-1.24%
jan 1, 1974
9.331
+0.18
1.97%
jan 1, 1975
8.897
-0.434
-4.65%
jan 1, 1976
9.086
+0.189
2.13%
jan 1, 1977
8.457
-0.629
-6.92%
jan 1, 1978
8.376
-0.081
-0.96%
jan 1, 1979
8.314
-0.061
-0.73%
jan 1, 1980
8.185
-0.13
-1.56%
jan 1, 1981
7.879
-0.306
-3.73%
jan 1, 1982
7.658
-0.221
-2.81%
jan 1, 1983
7.562
-0.096
-1.25%
jan 1, 1984
7.62
+0.058
0.77%
jan 1, 1985
7.154
-0.466
-6.12%
jan 1, 1986
6.994
-0.159
-2.23%
jan 1, 1987
7.136
+0.141
2.02%
jan 1, 1988
7.088
-0.048
-0.67%
jan 1, 1989
6.996
-0.092
-1.3%
jan 1, 1990
6.702
-0.294
-4.2%
jan 1, 1991
6.848
+0.146
2.17%
jan 1, 1992
6.464
-0.384
-5.6%
jan 1, 1993
5.771
-0.693
-10.72%
jan 1, 1994
4.909
-0.862
-14.93%
jan 1, 1995
4.316
-0.593
-12.07%
jan 1, 1996
4.142
-0.175
-4.05%
jan 1, 1997
4.089
-0.052
-1.27%
jan 1, 1998
3.375
-0.715
-17.47%
jan 1, 1999
3.218
-0.156
-4.64%
jan 1, 2000
0.693
-2.525
-78.46%
jan 1, 2001
0.61
-0.083
-11.93%
jan 1, 2002
0.851
+0.24
39.34%
jan 1, 2003
0.813
-0.038
-4.43%
jan 1, 2004
0.564
-0.248
-30.56%
jan 1, 2005
0.589
+0.025
4.39%
jan 1, 2006
0.865
+0.276
46.87%
jan 1, 2007
1.051
+0.186
21.48%
jan 1, 2008
0.633
-0.419
-39.84%
jan 1, 2009
0.638
+0.006
0.88%
jan 1, 2010
0.72
+0.082
12.81%
jan 1, 2011
0.702
-0.018
-2.47%
jan 1, 2012
0.654
-0.048
-6.86%
jan 1, 2013
0.631
-0.023
-3.5%
jan 1, 2014
0.632
+0.001
0.17%
jan 1, 2015
0.547
-0.085
-13.39%
Ranking of countries by current statistics by years


Comments: