29
/
en
AIzaSyAYiBZKx7MnpbEhh9jyipgxe19OcubqV5w
April 1, 2024
39198
IDA only
IDX
false
2
1
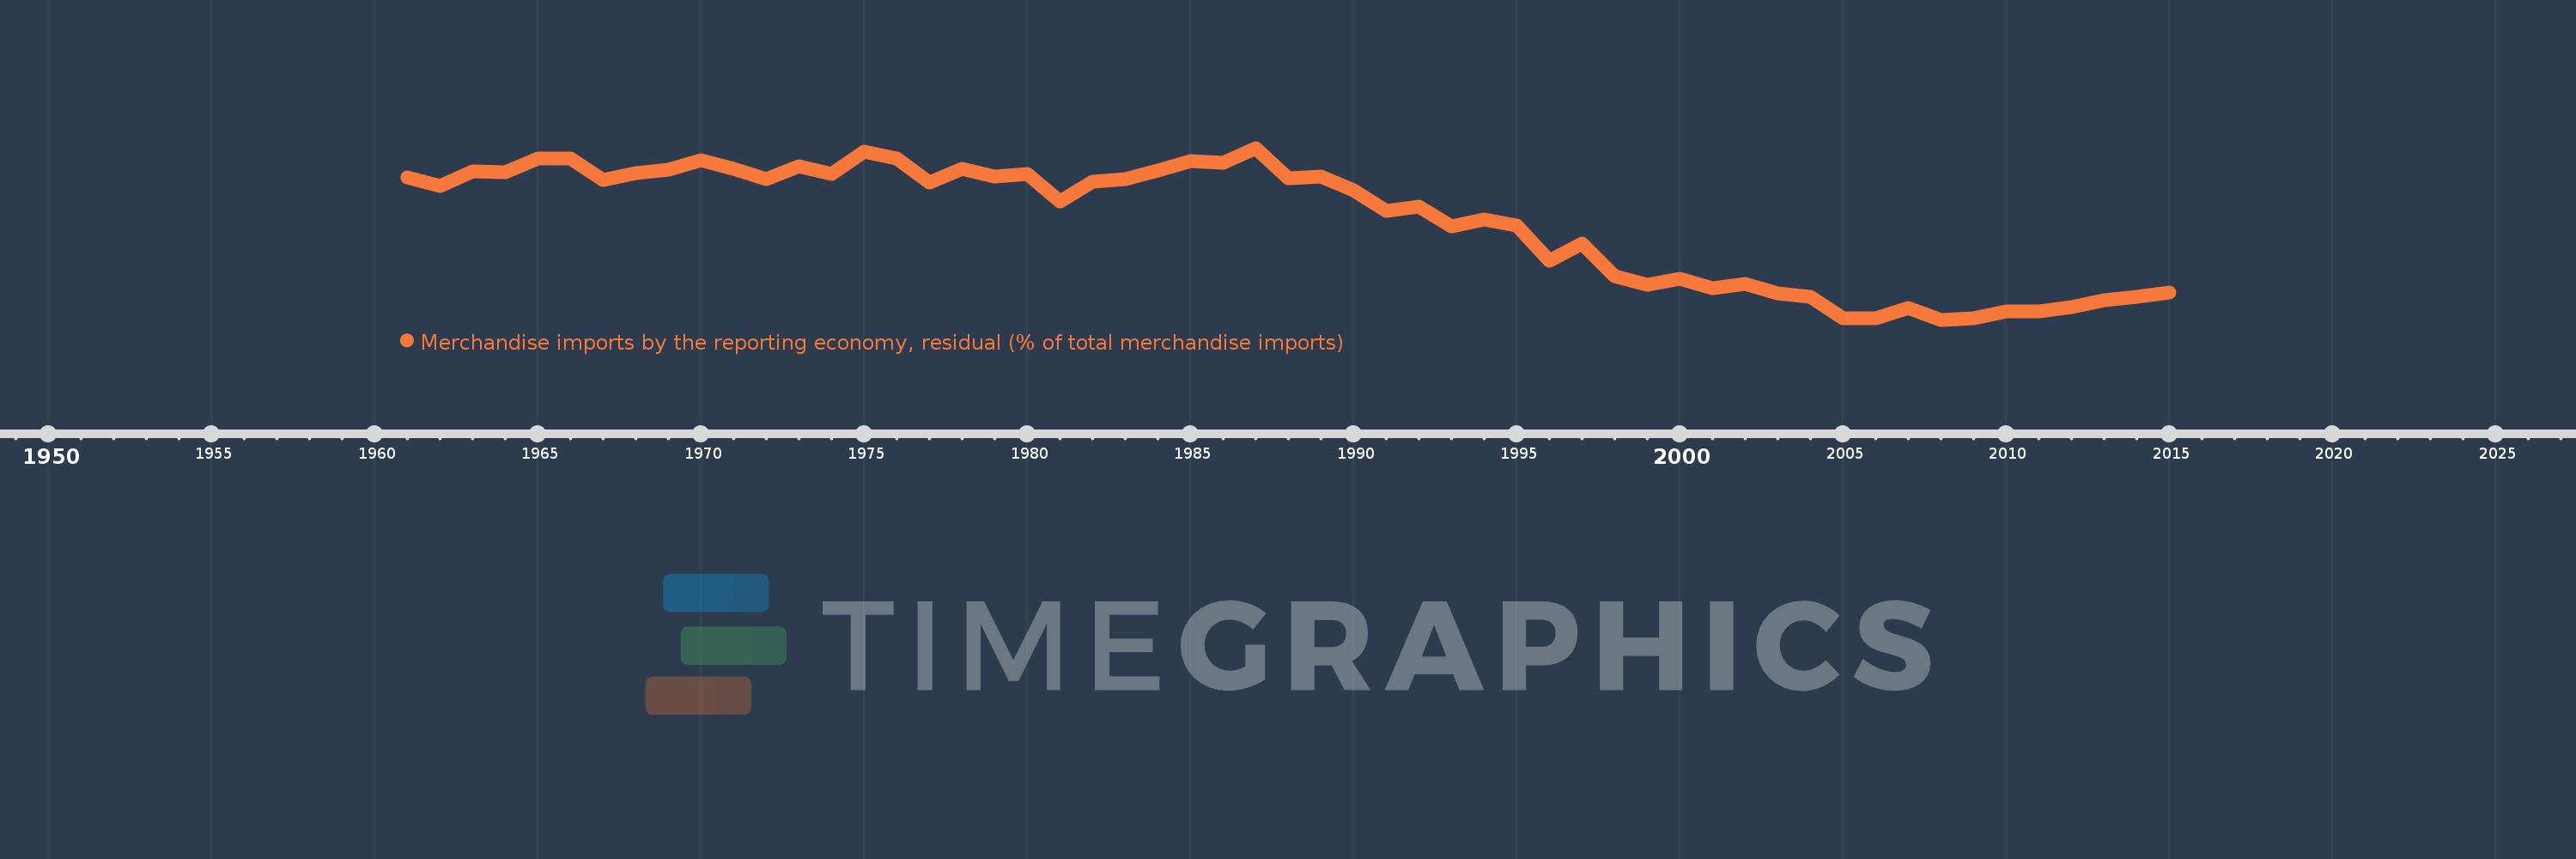
Merchandise imports by the reporting economy, residual (% of total merchandise imports)
2015,2014,2013,2012,2011,2010,2009,2008,2007,2006,2005,2004,2003,2002,2001,2000,1999,1998,1997,1996,1995,1994,1993,1992,1991,1990,1989,1988,1987,1986,1985,1984,1983,1982,1981,1980,1979,1978,1977,1976,1975,1974,1973,1972,1971,1970,1969,1968,1967,1966,1965,1964,1963,1962,1961
This statistics in other country:
AfghanistanAlbaniaAlgeriaAmerican SamoaAngolaAntigua and BarbudaArab WorldArgentinaArmeniaArubaAustraliaAustriaAzerbaijanBahamas, TheBahrainBangladeshBarbadosBelarusBelgiumBelizeBeninBermudaBoliviaBosnia and HerzegovinaBrazilBrunei DarussalamBulgariaBurkina FasoBurundiCabo VerdeCambodiaCameroonCanadaCaribbean small statesCentral African RepublicCentral Europe and the BalticsChadChileChinaColombiaComorosCongo, Dem. Rep.Congo, Rep.Costa RicaCote d'IvoireCroatiaCubaCyprusCzech RepublicDenmarkDjiboutiDominicaDominican RepublicEarly-demographic dividendEast Asia & PacificEast Asia & Pacific (excluding high income)East Asia & Pacific (IDA & IBRD countries)EcuadorEgypt, Arab Rep.El SalvadorEquatorial GuineaEstoniaEthiopiaEuro areaEurope & Central AsiaEurope & Central Asia (excluding high income)Europe & Central Asia (IDA & IBRD countries)European UnionFaroe IslandsFijiFinlandFragile and conflict affected situationsFranceFrench PolynesiaGabonGambia, TheGeorgiaGermanyGhanaGibraltarGreeceGreenlandGrenadaGuamGuatemalaGuineaGuinea-BissauGuyanaHaitiHeavily indebted poor countries (HIPC)High incomeHondurasHong Kong SAR, ChinaHungaryIBRD onlyIcelandIDA & IBRD totalIDA blendIDA onlyIDA totalIndiaIndonesiaIran, Islamic Rep.IraqIrelandIsraelItalyJamaicaJapanJordanKazakhstanKenyaKiribatiKorea, Dem. People’s Rep.Korea, Rep.KosovoKuwaitKyrgyz RepublicLao PDRLate-demographic dividendLatin America & Caribbean Latin America & Caribbean (excluding high income)Latin America & the Caribbean (IDA & IBRD countries)LatviaLeast developed countries: UN classificationLebanonLiberiaLibyaLithuaniaLow & middle incomeLow incomeLower middle incomeLuxembourgMacao SAR, ChinaMacedonia, FYRMadagascarMalawiMalaysiaMaldivesMaliMaltaMauritaniaMauritiusMexicoMiddle East & North AfricaMiddle East & North Africa (excluding high income)Middle East & North Africa (IDA & IBRD countries)Middle incomeMoldovaMongoliaMontenegroMoroccoMozambiqueMyanmarNauruNepalNetherlandsNew CaledoniaNew ZealandNicaraguaNigerNigeriaNorth AmericaNorwayOECD membersOmanOther small statesPacific island small statesPakistanPanamaPapua New GuineaParaguayPeruPhilippinesPolandPortugalPost-demographic dividendPre-demographic dividendQatarRomaniaRussian FederationRwandaSamoaSao Tome and PrincipeSaudi ArabiaSenegalSerbiaSeychellesSierra LeoneSingaporeSlovak RepublicSloveniaSmall statesSolomon IslandsSomaliaSouth AfricaSouth AsiaSouth Asia (IDA & IBRD)SpainSri LankaSt. Kitts and NevisSt. LuciaSt. Vincent and the GrenadinesSub-Saharan Africa Sub-Saharan Africa (excluding high income)Sub-Saharan Africa (IDA & IBRD countries)SudanSurinameSwedenSwitzerlandSyrian Arab RepublicTajikistanTanzaniaThailandTogoTongaTrinidad and TobagoTunisiaTurkeyTurkmenistanTuvaluUgandaUkraineUnited Arab EmiratesUnited KingdomUnited StatesUpper middle incomeUruguayUzbekistanVanuatuVenezuela, RBVietnamWorldYemen, Rep.ZambiaZimbabwe Timeline:
This timeline shows a graph from 1961 to 2015 of IDA only. No data until 1960. Number of actual observations by date: 55.
Source name:
World Development Indicators
Source organization:
World Bank staff estimates based data from International Monetary Fund's Direction of Trade database.
Categories, topics:
Private Sector, Trade
Last updated:
apr 23, 2017
Indicators value changes by year
Maximum:
22.781
jan 1, 1987
At the date of observation
Value
Absolute change
Change from previous value
jan 1, 1961
19.706
+19.706
0.0%
jan 1, 1962
18.821
-0.885
-4.49%
jan 1, 1963
20.346
+1.525
8.1%
jan 1, 1964
20.286
-0.06
-0.29%
jan 1, 1965
21.719
+1.433
7.06%
jan 1, 1966
21.668
-0.051
-0.24%
jan 1, 1967
19.526
-2.142
-9.89%
jan 1, 1968
20.147
+0.62
3.18%
jan 1, 1969
20.526
+0.379
1.88%
jan 1, 1970
21.493
+0.968
4.71%
jan 1, 1971
20.673
-0.82
-3.82%
jan 1, 1972
19.551
-1.123
-5.43%
jan 1, 1973
20.916
+1.366
6.99%
jan 1, 1974
20.083
-0.834
-3.99%
jan 1, 1975
22.408
+2.325
11.58%
jan 1, 1976
21.701
-0.707
-3.15%
jan 1, 1977
19.206
-2.495
-11.5%
jan 1, 1978
20.605
+1.399
7.28%
jan 1, 1979
19.859
-0.746
-3.62%
jan 1, 1980
20.112
+0.253
1.28%
jan 1, 1981
17.286
-2.826
-14.05%
jan 1, 1982
19.285
+1.999
11.57%
jan 1, 1983
19.555
+0.27
1.4%
jan 1, 1984
20.499
+0.944
4.83%
jan 1, 1985
21.421
+0.921
4.49%
jan 1, 1986
21.233
-0.187
-0.88%
jan 1, 1987
22.781
+1.547
7.29%
jan 1, 1988
19.62
-3.161
-13.88%
jan 1, 1989
19.866
+0.246
1.25%
jan 1, 1990
18.407
-1.458
-7.34%
jan 1, 1991
16.313
-2.095
-11.38%
jan 1, 1992
16.757
+0.444
2.72%
jan 1, 1993
14.732
-2.025
-12.09%
jan 1, 1994
15.435
+0.703
4.77%
jan 1, 1995
14.767
-0.667
-4.32%
jan 1, 1996
11.198
-3.569
-24.17%
jan 1, 1997
12.983
+1.785
15.94%
jan 1, 1998
9.555
-3.428
-26.4%
jan 1, 1999
8.677
-0.878
-9.19%
jan 1, 2000
9.349
+0.672
7.74%
jan 1, 2001
8.372
-0.977
-10.45%
jan 1, 2002
8.776
+0.403
4.82%
jan 1, 2003
7.808
-0.967
-11.02%
jan 1, 2004
7.476
-0.332
-4.26%
jan 1, 2005
5.236
-2.24
-29.97%
jan 1, 2006
5.25
+0.014
0.27%
jan 1, 2007
6.349
+1.1
20.95%
jan 1, 2008
5.1
-1.249
-19.67%
jan 1, 2009
5.239
+0.138
2.71%
jan 1, 2010
5.961
+0.723
13.8%
jan 1, 2011
5.99
+0.029
0.49%
jan 1, 2012
6.386
+0.396
6.61%
jan 1, 2013
7.083
+0.697
10.91%
jan 1, 2014
7.472
+0.389
5.49%
jan 1, 2015
7.861
+0.389
5.2%
Ranking of countries by current statistics by years


Comments: