29
/
en
AIzaSyAYiBZKx7MnpbEhh9jyipgxe19OcubqV5w
April 1, 2024
106245
China
CHN
true
2
1
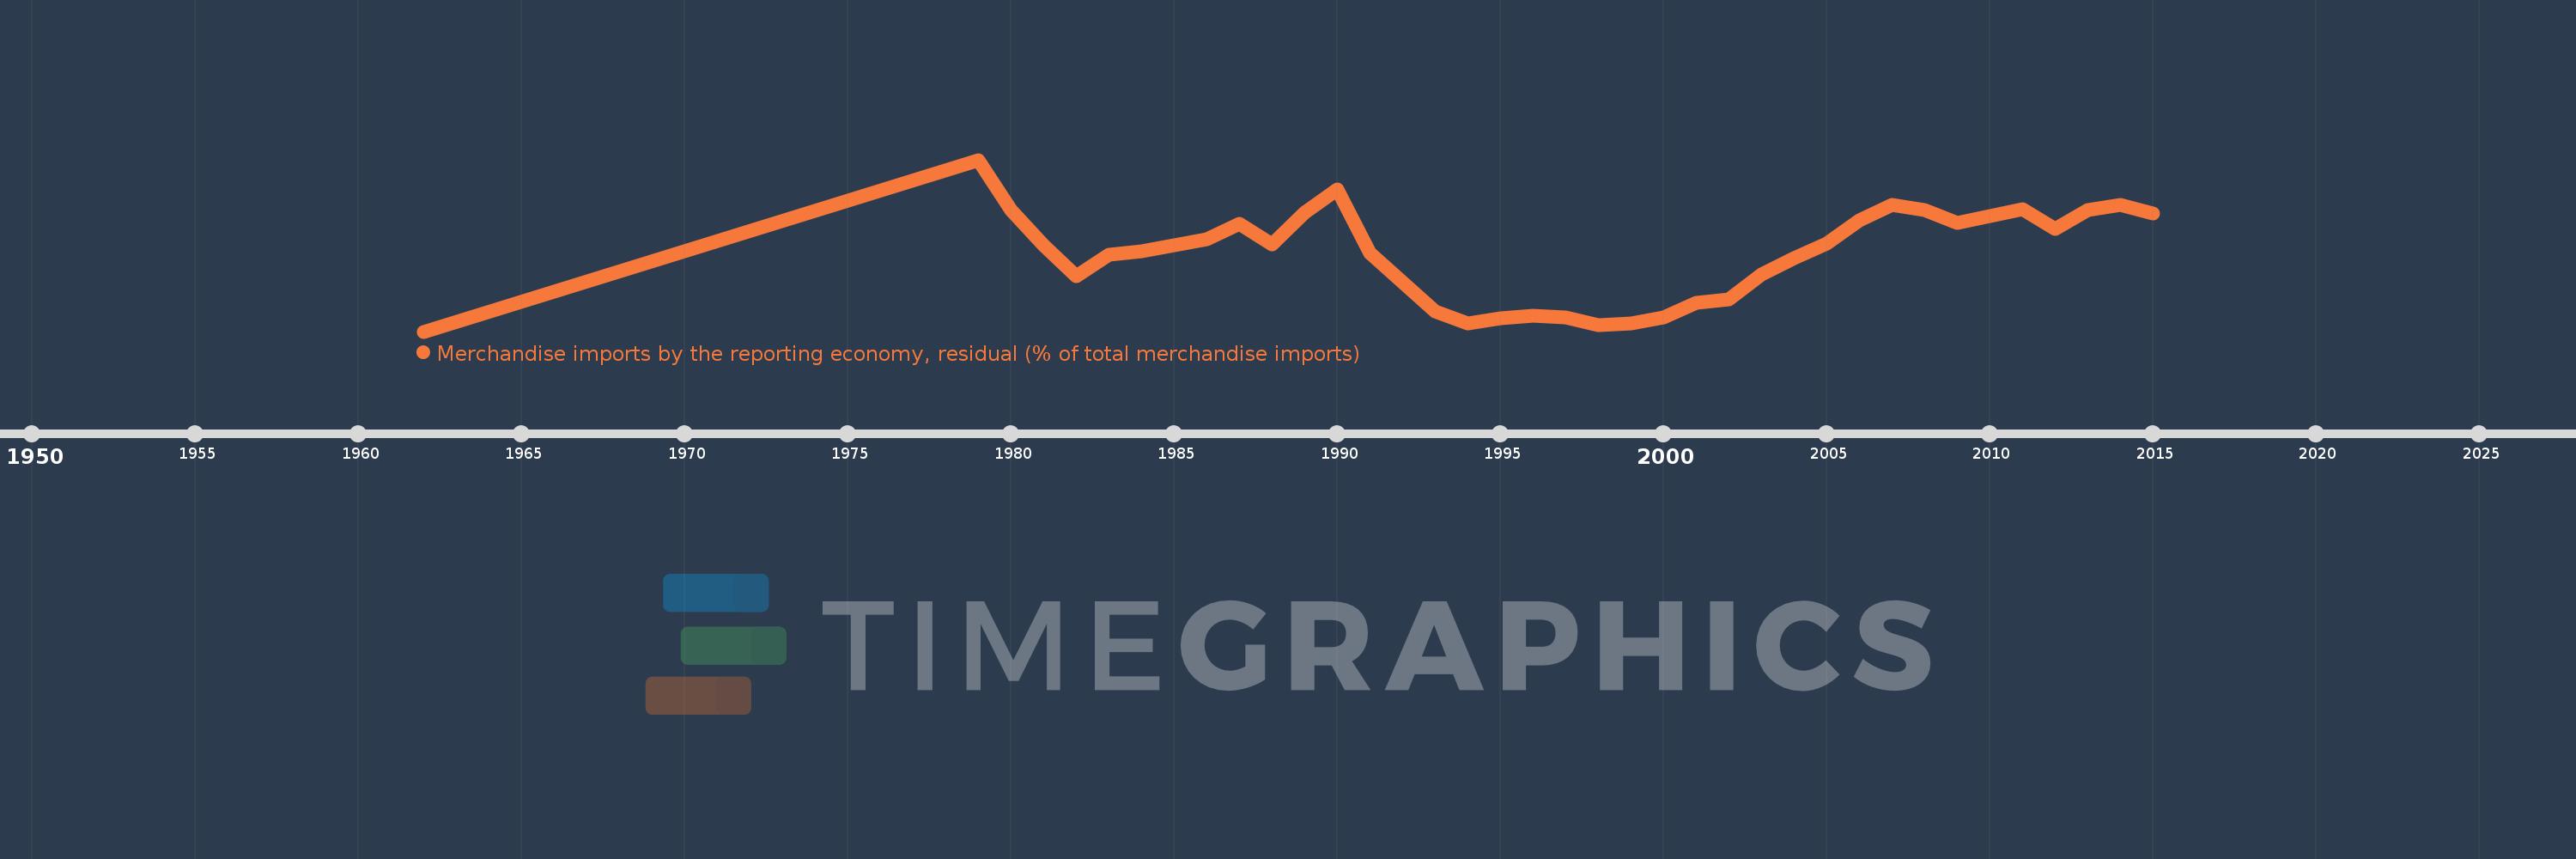
Merchandise imports by the reporting economy, residual (% of total merchandise imports)
2015,2014,2013,2012,2011,2010,2009,2008,2007,2006,2005,2004,2003,2002,2001,2000,1999,1998,1997,1996,1995,1994,1993,1992,1991,1990,1989,1988,1987,1986,1985,1984,1983,1982,1981,1980,1979,1962
This statistics in other country:
AfghanistanAlbaniaAlgeriaAmerican SamoaAngolaAntigua and BarbudaArab WorldArgentinaArmeniaArubaAustraliaAustriaAzerbaijanBahamas, TheBahrainBangladeshBarbadosBelarusBelgiumBelizeBeninBermudaBoliviaBosnia and HerzegovinaBrazilBrunei DarussalamBulgariaBurkina FasoBurundiCabo VerdeCambodiaCameroonCanadaCaribbean small statesCentral African RepublicCentral Europe and the BalticsChadChileChinaColombiaComorosCongo, Dem. Rep.Congo, Rep.Costa RicaCote d'IvoireCroatiaCubaCyprusCzech RepublicDenmarkDjiboutiDominicaDominican RepublicEarly-demographic dividendEast Asia & PacificEast Asia & Pacific (excluding high income)East Asia & Pacific (IDA & IBRD countries)EcuadorEgypt, Arab Rep.El SalvadorEquatorial GuineaEstoniaEthiopiaEuro areaEurope & Central AsiaEurope & Central Asia (excluding high income)Europe & Central Asia (IDA & IBRD countries)European UnionFaroe IslandsFijiFinlandFragile and conflict affected situationsFranceFrench PolynesiaGabonGambia, TheGeorgiaGermanyGhanaGibraltarGreeceGreenlandGrenadaGuamGuatemalaGuineaGuinea-BissauGuyanaHaitiHeavily indebted poor countries (HIPC)High incomeHondurasHong Kong SAR, ChinaHungaryIBRD onlyIcelandIDA & IBRD totalIDA blendIDA onlyIDA totalIndiaIndonesiaIran, Islamic Rep.IraqIrelandIsraelItalyJamaicaJapanJordanKazakhstanKenyaKiribatiKorea, Dem. People’s Rep.Korea, Rep.KosovoKuwaitKyrgyz RepublicLao PDRLate-demographic dividendLatin America & Caribbean Latin America & Caribbean (excluding high income)Latin America & the Caribbean (IDA & IBRD countries)LatviaLeast developed countries: UN classificationLebanonLiberiaLibyaLithuaniaLow & middle incomeLow incomeLower middle incomeLuxembourgMacao SAR, ChinaMacedonia, FYRMadagascarMalawiMalaysiaMaldivesMaliMaltaMauritaniaMauritiusMexicoMiddle East & North AfricaMiddle East & North Africa (excluding high income)Middle East & North Africa (IDA & IBRD countries)Middle incomeMoldovaMongoliaMontenegroMoroccoMozambiqueMyanmarNauruNepalNetherlandsNew CaledoniaNew ZealandNicaraguaNigerNigeriaNorth AmericaNorwayOECD membersOmanOther small statesPacific island small statesPakistanPanamaPapua New GuineaParaguayPeruPhilippinesPolandPortugalPost-demographic dividendPre-demographic dividendQatarRomaniaRussian FederationRwandaSamoaSao Tome and PrincipeSaudi ArabiaSenegalSerbiaSeychellesSierra LeoneSingaporeSlovak RepublicSloveniaSmall statesSolomon IslandsSomaliaSouth AfricaSouth AsiaSouth Asia (IDA & IBRD)SpainSri LankaSt. Kitts and NevisSt. LuciaSt. Vincent and the GrenadinesSub-Saharan Africa Sub-Saharan Africa (excluding high income)Sub-Saharan Africa (IDA & IBRD countries)SudanSurinameSwedenSwitzerlandSyrian Arab RepublicTajikistanTanzaniaThailandTogoTongaTrinidad and TobagoTunisiaTurkeyTurkmenistanTuvaluUgandaUkraineUnited Arab EmiratesUnited KingdomUnited StatesUpper middle incomeUruguayUzbekistanVanuatuVenezuela, RBVietnamWorldYemen, Rep.ZambiaZimbabwe Timeline:
This timeline shows a graph from 1962 to 2015 of China. No data until 1961. Number of actual observations by date: 38.
Source name:
World Development Indicators
Source organization:
World Bank staff estimates based data from International Monetary Fund's Direction of Trade database.
Categories, topics:
Private Sector, Trade
Last updated:
apr 23, 2017
Indicators value changes by year
Maximum:
11.973
jan 1, 1979
At the date of observation
Value
Absolute change
Change from previous value
jan 1, 1962
1.674
+1.674
0.0%
jan 1, 1979
11.973
+10.299
615.3%
jan 1, 1980
8.984
-2.989
-24.96%
jan 1, 1981
6.852
-2.133
-23.74%
jan 1, 1982
4.975
-1.877
-27.39%
jan 1, 1983
6.28
+1.305
26.22%
jan 1, 1984
6.478
+0.198
3.16%
jan 1, 1985
6.852
+0.374
5.78%
jan 1, 1986
7.227
+0.375
5.47%
jan 1, 1987
8.126
+0.899
12.44%
jan 1, 1988
6.924
-1.202
-14.8%
jan 1, 1989
8.784
+1.86
26.87%
jan 1, 1990
10.197
+1.413
16.08%
jan 1, 1991
6.375
-3.822
-37.48%
jan 1, 1992
4.658
-1.716
-26.93%
jan 1, 1993
2.892
-1.766
-37.91%
jan 1, 1994
2.165
-0.727
-25.13%
jan 1, 1995
2.485
+0.32
14.77%
jan 1, 1996
2.623
+0.137
5.53%
jan 1, 1997
2.502
-0.12
-4.58%
jan 1, 1998
2.049
-0.454
-18.14%
jan 1, 1999
2.156
+0.107
5.24%
jan 1, 2000
2.503
+0.347
16.09%
jan 1, 2001
3.388
+0.885
35.37%
jan 1, 2002
3.604
+0.217
6.39%
jan 1, 2003
5.122
+1.517
42.09%
jan 1, 2004
6.085
+0.964
18.81%
jan 1, 2005
6.929
+0.843
13.86%
jan 1, 2006
8.365
+1.436
20.73%
jan 1, 2007
9.274
+0.909
10.87%
jan 1, 2008
8.969
-0.305
-3.29%
jan 1, 2009
8.171
-0.798
-8.89%
jan 1, 2010
8.612
+0.44
5.39%
jan 1, 2011
9.018
+0.406
4.72%
jan 1, 2012
7.822
-1.195
-13.25%
jan 1, 2013
8.978
+1.155
14.77%
jan 1, 2014
9.291
+0.313
3.49%
jan 1, 2015
8.731
-0.56
-6.03%
Ranking of countries by current statistics by years


Comments: