29
/
en
AIzaSyAYiBZKx7MnpbEhh9jyipgxe19OcubqV5w
April 1, 2024
134366
France
FRA
true
2
1
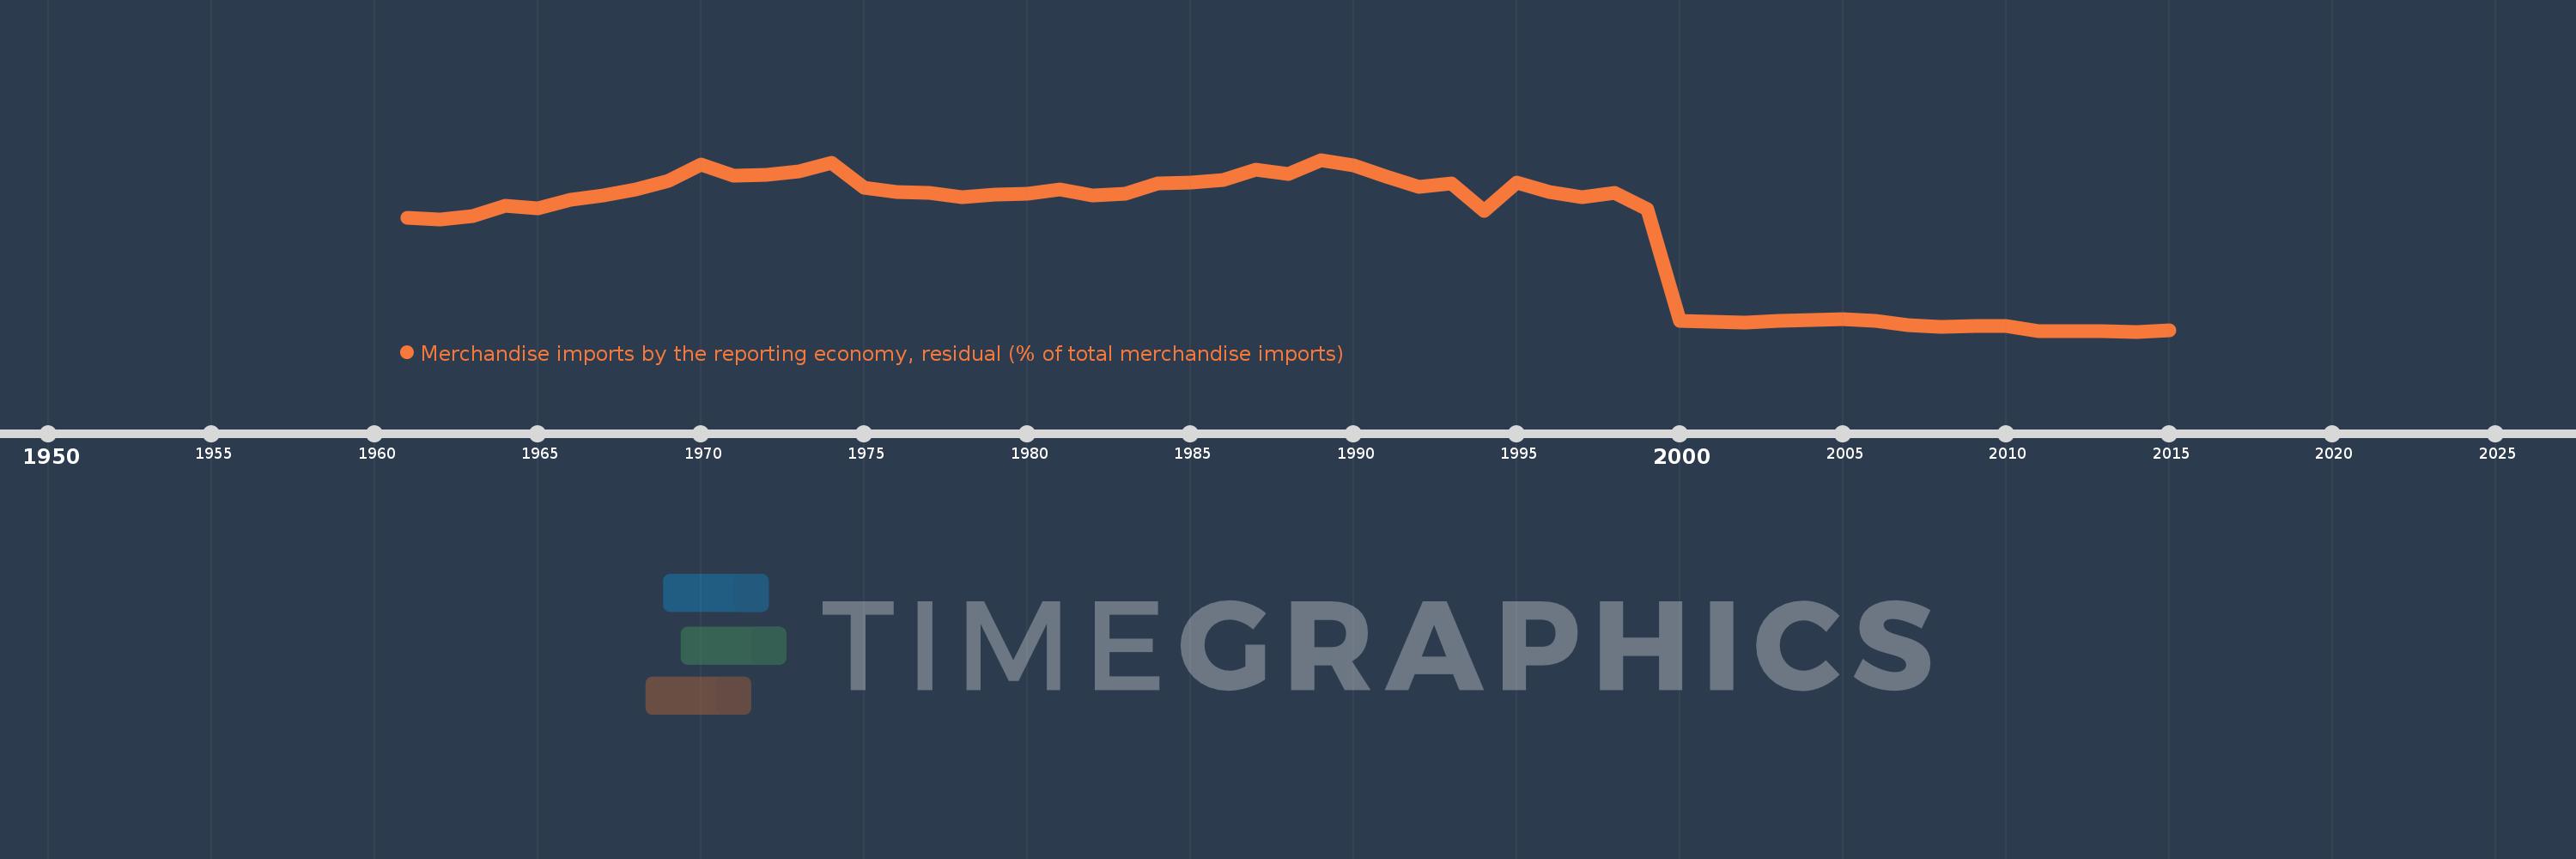
Merchandise imports by the reporting economy, residual (% of total merchandise imports)
2015,2014,2013,2012,2011,2010,2009,2008,2007,2006,2005,2004,2003,2002,2001,2000,1999,1998,1997,1996,1995,1994,1993,1992,1991,1990,1989,1988,1987,1986,1985,1984,1983,1982,1981,1980,1979,1978,1977,1976,1975,1974,1973,1972,1971,1970,1969,1968,1967,1966,1965,1964,1963,1962,1961
This statistics in other country:
AfghanistanAlbaniaAlgeriaAmerican SamoaAngolaAntigua and BarbudaArab WorldArgentinaArmeniaArubaAustraliaAustriaAzerbaijanBahamas, TheBahrainBangladeshBarbadosBelarusBelgiumBelizeBeninBermudaBoliviaBosnia and HerzegovinaBrazilBrunei DarussalamBulgariaBurkina FasoBurundiCabo VerdeCambodiaCameroonCanadaCaribbean small statesCentral African RepublicCentral Europe and the BalticsChadChileChinaColombiaComorosCongo, Dem. Rep.Congo, Rep.Costa RicaCote d'IvoireCroatiaCubaCyprusCzech RepublicDenmarkDjiboutiDominicaDominican RepublicEarly-demographic dividendEast Asia & PacificEast Asia & Pacific (excluding high income)East Asia & Pacific (IDA & IBRD countries)EcuadorEgypt, Arab Rep.El SalvadorEquatorial GuineaEstoniaEthiopiaEuro areaEurope & Central AsiaEurope & Central Asia (excluding high income)Europe & Central Asia (IDA & IBRD countries)European UnionFaroe IslandsFijiFinlandFragile and conflict affected situationsFranceFrench PolynesiaGabonGambia, TheGeorgiaGermanyGhanaGibraltarGreeceGreenlandGrenadaGuamGuatemalaGuineaGuinea-BissauGuyanaHaitiHeavily indebted poor countries (HIPC)High incomeHondurasHong Kong SAR, ChinaHungaryIBRD onlyIcelandIDA & IBRD totalIDA blendIDA onlyIDA totalIndiaIndonesiaIran, Islamic Rep.IraqIrelandIsraelItalyJamaicaJapanJordanKazakhstanKenyaKiribatiKorea, Dem. People’s Rep.Korea, Rep.KosovoKuwaitKyrgyz RepublicLao PDRLate-demographic dividendLatin America & Caribbean Latin America & Caribbean (excluding high income)Latin America & the Caribbean (IDA & IBRD countries)LatviaLeast developed countries: UN classificationLebanonLiberiaLibyaLithuaniaLow & middle incomeLow incomeLower middle incomeLuxembourgMacao SAR, ChinaMacedonia, FYRMadagascarMalawiMalaysiaMaldivesMaliMaltaMauritaniaMauritiusMexicoMiddle East & North AfricaMiddle East & North Africa (excluding high income)Middle East & North Africa (IDA & IBRD countries)Middle incomeMoldovaMongoliaMontenegroMoroccoMozambiqueMyanmarNauruNepalNetherlandsNew CaledoniaNew ZealandNicaraguaNigerNigeriaNorth AmericaNorwayOECD membersOmanOther small statesPacific island small statesPakistanPanamaPapua New GuineaParaguayPeruPhilippinesPolandPortugalPost-demographic dividendPre-demographic dividendQatarRomaniaRussian FederationRwandaSamoaSao Tome and PrincipeSaudi ArabiaSenegalSerbiaSeychellesSierra LeoneSingaporeSlovak RepublicSloveniaSmall statesSolomon IslandsSomaliaSouth AfricaSouth AsiaSouth Asia (IDA & IBRD)SpainSri LankaSt. Kitts and NevisSt. LuciaSt. Vincent and the GrenadinesSub-Saharan Africa Sub-Saharan Africa (excluding high income)Sub-Saharan Africa (IDA & IBRD countries)SudanSurinameSwedenSwitzerlandSyrian Arab RepublicTajikistanTanzaniaThailandTogoTongaTrinidad and TobagoTunisiaTurkeyTurkmenistanTuvaluUgandaUkraineUnited Arab EmiratesUnited KingdomUnited StatesUpper middle incomeUruguayUzbekistanVanuatuVenezuela, RBVietnamWorldYemen, Rep.ZambiaZimbabwe Timeline:
This timeline shows a graph from 1961 to 2015 of France. No data until 1960. Number of actual observations by date: 55.
Source name:
World Development Indicators
Source organization:
World Bank staff estimates based data from International Monetary Fund's Direction of Trade database.
Categories, topics:
Private Sector, Trade
Last updated:
apr 23, 2017
Indicators value changes by year
Maximum:
14.981
jan 1, 1989
At the date of observation
Value
Absolute change
Change from previous value
jan 1, 1961
9.949
+9.949
0.0%
jan 1, 1962
9.787
-0.162
-1.63%
jan 1, 1963
10.064
+0.276
2.82%
jan 1, 1964
10.988
+0.924
9.18%
jan 1, 1965
10.777
-0.21
-1.91%
jan 1, 1966
11.487
+0.71
6.59%
jan 1, 1967
11.92
+0.432
3.76%
jan 1, 1968
12.413
+0.494
4.14%
jan 1, 1969
13.125
+0.711
5.73%
jan 1, 1970
14.601
+1.477
11.25%
jan 1, 1971
13.637
-0.965
-6.61%
jan 1, 1972
13.677
+0.041
0.3%
jan 1, 1973
14.008
+0.331
2.42%
jan 1, 1974
14.757
+0.75
5.35%
jan 1, 1975
12.545
-2.213
-14.99%
jan 1, 1976
12.207
-0.338
-2.69%
jan 1, 1977
12.084
-0.123
-1.01%
jan 1, 1978
11.714
-0.37
-3.06%
jan 1, 1979
11.938
+0.224
1.91%
jan 1, 1980
12.041
+0.103
0.86%
jan 1, 1981
12.407
+0.367
3.05%
jan 1, 1982
11.882
-0.525
-4.23%
jan 1, 1983
12.035
+0.153
1.29%
jan 1, 1984
12.893
+0.858
7.13%
jan 1, 1985
12.992
+0.1
0.77%
jan 1, 1986
13.248
+0.255
1.96%
jan 1, 1987
14.138
+0.891
6.72%
jan 1, 1988
13.777
-0.361
-2.56%
jan 1, 1989
14.981
+1.204
8.74%
jan 1, 1990
14.504
-0.477
-3.18%
jan 1, 1991
13.517
-0.987
-6.81%
jan 1, 1992
12.665
-0.852
-6.3%
jan 1, 1993
12.918
+0.253
1.99%
jan 1, 1994
10.549
-2.369
-18.34%
jan 1, 1995
13.014
+2.465
23.37%
jan 1, 1996
12.189
-0.825
-6.34%
jan 1, 1997
11.743
-0.446
-3.66%
jan 1, 1998
12.14
+0.397
3.38%
jan 1, 1999
10.676
-1.463
-12.05%
jan 1, 2000
1.009
-9.667
-90.55%
jan 1, 2001
0.886
-0.124
-12.24%
jan 1, 2002
0.846
-0.04
-4.51%
jan 1, 2003
0.966
+0.12
14.18%
jan 1, 2004
1.039
+0.073
7.58%
jan 1, 2005
1.128
+0.089
8.58%
jan 1, 2006
1.01
-0.118
-10.45%
jan 1, 2007
0.584
-0.426
-42.19%
jan 1, 2008
0.491
-0.093
-16.0%
jan 1, 2009
0.538
+0.048
9.72%
jan 1, 2010
0.562
+0.024
4.37%
jan 1, 2011
0.1
-0.461
-82.14%
jan 1, 2012
0.091
-0.01
-9.72%
jan 1, 2013
0.066
-0.024
-26.73%
jan 1, 2014
0.054
-0.012
-18.78%
jan 1, 2015
0.182
+0.128
237.05%
Ranking of countries by current statistics by years


Comments: